What is the first step in performing a hypothesis test for a population mean in Excel?
The first step is to write the null and alternative hypotheses based on the claim and expected value.
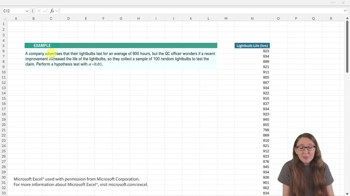
Which Excel function is used to find the p-value directly when the population standard deviation (sigma) is known?
The z.test function is used to find the right-tail p-value directly when sigma is known.
What are the three inputs required for the z.test function in Excel?
The three inputs are the data array, the expected population mean (mu), and the population standard deviation (sigma).
How do you interpret the p-value in relation to the alpha level in hypothesis testing?
If the p-value is less than alpha, you reject the null hypothesis; if it is greater, you fail to reject the null hypothesis.
What conclusion can you draw if the p-value is less than the alpha level?
You reject the null hypothesis and conclude there is enough evidence to support the alternative hypothesis.
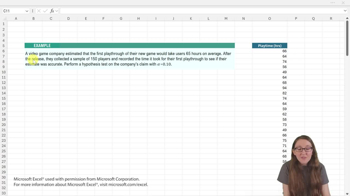
Which distribution is used for hypothesis testing when sigma is unknown?
The t-distribution is used when the population standard deviation (sigma) is unknown.
What formula is used to calculate the t score in Excel for hypothesis testing?
The t score is calculated as (x̄ - μ) / (s / sqrt(n)), where x̄ is the sample mean, μ is the expected mean, s is the sample standard deviation, and n is the sample size.
How do you find the sample mean (x̄) in Excel?
Use the equals average function (e.g., =AVERAGE(data range)) to calculate the sample mean.
How is the sample standard deviation (s) calculated in Excel?
Use the equals stdev function (e.g., =STDEV(data range)) to calculate the sample standard deviation.
How do you determine the degrees of freedom for a t-test in Excel?
Degrees of freedom are calculated as n - 1, where n is the sample size.
Which Excel function is used to find the cumulative left-tail probability for a t score?
The t.dist function is used with the inputs: t score, degrees of freedom, and TRUE for cumulative probability.
What does it mean if the p-value is greater than the alpha level in a t-test?
It means you fail to reject the null hypothesis and there is not enough evidence to support the alternative hypothesis.
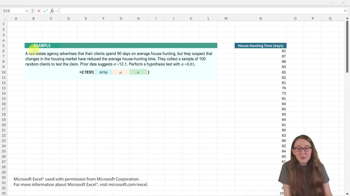
How do you decide whether to use a right-tail or left-tail probability in hypothesis testing?
The direction is determined by the alternative hypothesis: use right-tail for 'greater than' and left-tail for 'less than'.
What is the null hypothesis for a test where the expected mean is 25?
The null hypothesis is that the population mean (mu) equals 25.
What is the alternative hypothesis if a pizza place claims the average delivery wait time is less than 25 minutes?
The alternative hypothesis is that the population mean (mu) is less than 25.
 Back
Back

 04:28
04:28