Skip to main content
Statistics for Business
My Course
Learn
Exam Prep
AI Tutor
Study Guides
Flashcards
Explore
Try the app
My Course
Learn
Exam Prep
AI Tutor
Study Guides
Flashcards
Explore
Try the app
Back
Hypothesis Tests for Correlation Coefficient Using TI-85 quiz
You can tap to flip the card.
What does a correlation coefficient r close to zero indicate about the relationship between two variables?
You can tap to flip the card.
👆
What does a correlation coefficient r close to zero indicate about the relationship between two variables?
It indicates weak or no linear correlation between the two variables.
Track progress
Control buttons has been changed to "navigation" mode.
1/15
Related flashcards
Related practice
Recommended videos
Hypothesis Tests for Correlation Coefficient Using TI-85 definitions
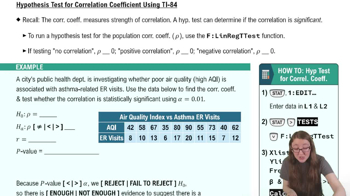
Hypothesis Tests for Correlation Coefficient Using TI-85
15 Terms
11. Correlation
2 topics
15 problems
Chapter
David-Paige
Guided course
05:28
Hypothesis Tests for Correlation Coefficient Using TI-84
106
views
Guided course
03:35
Hypothesis Tests for Correlation Coefficient Using TI-84 Example 1
73
views
1
rank
Guided course
06:24
Hypothesis Tests for Correlation Coefficient Using TI-84 Example 2
74
views
1
rank
Terms in this set (15)
Hide definitions
What does a correlation coefficient r close to zero indicate about the relationship between two variables?
It indicates weak or no linear correlation between the two variables.
What is the null hypothesis when testing the population correlation coefficient ρ?
The null hypothesis is that ρ equals zero, meaning there is no linear correlation between the variables.
What does the alternative hypothesis state in a two-sided test for correlation?
It states that ρ is not equal to zero, indicating a linear correlation exists.
Which function on the TI-84 calculator is used to test the correlation coefficient?
The LinReg t-test function is used to test the correlation coefficient.
What does a p-value less than the alpha level indicate in hypothesis testing for correlation?
It indicates that we reject the null hypothesis and conclude there is statistically significant linear correlation.
If the alternative hypothesis is ρ > 0, what type of correlation are you testing for?
You are testing for a positive linear correlation.
What should you do if the p-value is greater than the alpha level in a correlation test?
You fail to reject the null hypothesis, meaning there is not enough evidence for a linear correlation.
What is the first step when using the TI-84 to test for correlation?
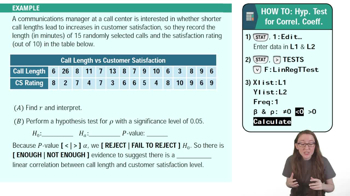
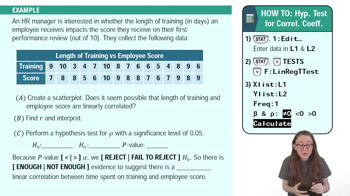
The first step is to enter your data into lists, typically L1 and L2.
What does the sample correlation coefficient r represent in the output of the LinReg t-test?
It represents the strength and direction of the linear relationship in your sample data.
Why is it important to choose the correct alternative hypothesis in the TI-84 LinReg t-test menu?
Because it determines whether you are testing for any correlation, positive correlation, or negative correlation.
What does a strong positive r value (e.g., r ≈ 0.99) suggest about the variables?
It suggests a strong positive linear correlation between the variables in the sample.
What is the purpose of comparing the p-value to the alpha level in hypothesis testing?
To decide whether to reject or fail to reject the null hypothesis.
Does this hypothesis test determine the exact value of the population correlation coefficient ρ?
No, it only tests whether there is evidence for a nonzero linear correlation, not the exact value of ρ.
What does the test establish if you reject the null hypothesis for ρ?
It establishes that there is a statistically significant linear correlation between the two variables.
Why is it important to read the problem text carefully when setting up your hypotheses?
Because the wording determines whether you test for any correlation, positive correlation, or negative correlation.
 BackBack
 05:28
05:28