Skip to main content
Statistics for Business
My Course
Learn
Exam Prep
AI Tutor
Study Guides
Flashcards
Explore
Try the app
My Course
Learn
Exam Prep
AI Tutor
Study Guides
Flashcards
Explore
Try the app
Back
Independence Tests - Excel definitions
You can tap to flip the card.
Chi-square Test
You can tap to flip the card.
👆
Chi-square Test
A statistical method used to assess whether two categorical variables are independent by comparing observed and expected frequencies.
Track progress
Control buttons has been changed to "navigation" mode.
1/15
Related flashcards
Related practice
Recommended videos
Independence Tests - Excel quiz
Independence Tests - Excel
15 Terms
13. Chi-Square Tests & Goodness of Fit
3 topics
15 problems
Chapter
Brendan
Guided course
06:38
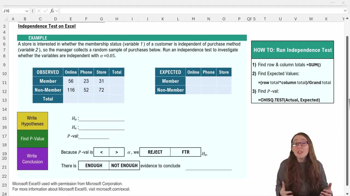
Independence Tests - Excel Example 1
48
views
1
rank
Guided course
07:08
Independence Tests - Excel
53
views
1
rank
Terms in this set (15)
Hide definitions
Chi-square Test
A statistical method used to assess whether two categorical variables are independent by comparing observed and expected frequencies.
Contingency Table
A matrix displaying the frequency distribution of variables, organizing observed counts by categories for analysis.
Row Total
The sum of observed frequencies across all columns for a specific row in a contingency table.
Column Total
The sum of observed frequencies down all rows for a specific column in a contingency table.
Grand Total
The overall sum of all observed frequencies in a contingency table, representing the total sample size.
Expected Value
A calculated frequency for a cell in a contingency table, found by multiplying row and column totals and dividing by the grand total.
Observed Frequency
The actual count recorded in each cell of a contingency table, based on collected data.
P-value
A probability measure indicating the strength of evidence against the null hypothesis in a statistical test.
Alpha Level
A threshold probability, such as 0.05, used to determine statistical significance in hypothesis testing.
Null Hypothesis
A statement proposing no association between variables, serving as the default assumption in hypothesis testing.
Alternative Hypothesis
A statement suggesting a relationship or dependence between variables, considered if evidence contradicts the null hypothesis.
Categorical Data
Data sorted into distinct groups or categories, often used in contingency tables for statistical analysis.
Statistical Inference
The process of drawing conclusions about populations based on sample data using probability and statistical tests.
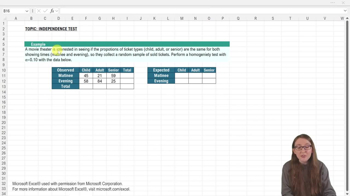
Homogeneity Test
A statistical procedure similar to the independence test, used to compare distributions of a categorical variable across groups.
CHISQ.TEST Function
An Excel function that calculates the p-value for a chi-square test by comparing observed and expected frequencies.
 BackBack
 06:38
06:38