Skip to main content
Statistics for Business
My Course
Learn
Exam Prep
AI Tutor
Study Guides
Flashcards
Explore
Try the app
My Course
Learn
Exam Prep
AI Tutor
Study Guides
Flashcards
Explore
Try the app
Back
Independence Tests - Excel quiz
You can tap to flip the card.
What is the null hypothesis in a chi-square test of independence?
You can tap to flip the card.
👆
What is the null hypothesis in a chi-square test of independence?
The null hypothesis states that the variables are independent of each other.
Track progress
Control buttons has been changed to "navigation" mode.
1/15
Related flashcards
Related practice
Recommended videos
Independence Tests - Excel definitions
Independence Tests - Excel
15 Terms
13. Chi-Square Tests & Goodness of Fit
3 topics
15 problems
Chapter
Brendan
Guided course
06:38
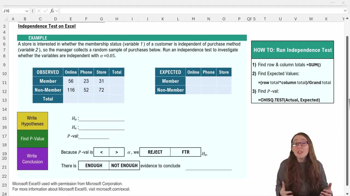
Independence Tests - Excel Example 1
48
views
1
rank
Guided course
07:08
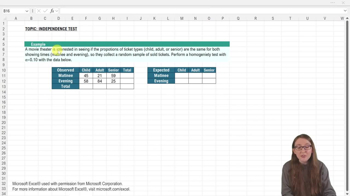
Independence Tests - Excel
53
views
1
rank
Terms in this set (15)
Hide definitions
What is the null hypothesis in a chi-square test of independence?
The null hypothesis states that the variables are independent of each other.
How do you calculate a column total in Excel for a contingency table?
Use the =SUM function to add all the values in the column.
What formula is used to calculate an expected value in a chi-square test of independence?
Expected value is calculated as (row total × column total) divided by the grand total.
Which Excel function is used to find the p-value for a chi-square test of independence?
The CHISQ.TEST function is used to find the p-value.
What does it mean if the p-value is greater than the alpha level in a chi-square test?
It means you fail to reject the null hypothesis, indicating insufficient evidence to say the variables are dependent.
Why is it helpful to create a separate table for expected values in Excel?
It keeps your expected values organized and makes calculations easier to manage.
What should you avoid including when selecting the observed frequencies range for CHISQ.TEST in Excel?
You should avoid including any row or column totals; only select the observed frequencies.
How do you check if your grand total calculation is correct in Excel?
Add together all row totals or all column totals and ensure they match the grand total.
What is the alternative hypothesis in a chi-square test of independence?
The alternative hypothesis states that the variables are not independent, or they are dependent.
What is the significance level (alpha) commonly used in hypothesis testing?
A common alpha level is 0.05.
What is the purpose of a contingency table in a chi-square test?
A contingency table organizes observed frequencies for two categorical variables.
How do you copy a SUM formula across multiple columns or rows in Excel?
Click and drag the formula across the desired columns or rows to copy it.
What is the main difference between an independence test and a homogeneity test in Excel?
The main difference is in how you word the hypotheses and conclusions; the calculations are the same.
What should you do if your expected values table does not match the example provided?
Double-click the cell to check and edit your formula, ensuring the correct references are used.
What does a p-value of 0.9 indicate in the context of a chi-square test with alpha 0.05?
It indicates strong evidence to fail to reject the null hypothesis, suggesting the variables are independent.
 BackBack
 06:38
06:38