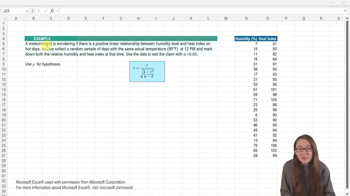
A numerical measure indicating the strength and direction of a linear relationship between two variables in a dataset.
Population Correlation Coefficient
A parameter, often denoted by the Greek letter ρ, representing the true linear relationship between two variables in an entire population.
Sample Data
A subset of observations collected from a larger group, used to estimate characteristics or test hypotheses about the population.
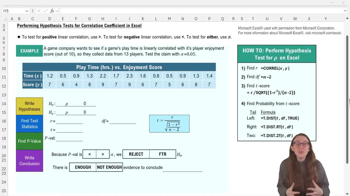
Null Hypothesis
A default assumption stating there is no effect or relationship, such as no linear correlation between variables.
Alternative Hypothesis
A claim tested against the null, suggesting a significant effect or relationship exists, like a nonzero correlation.
Alpha Level
A threshold probability, commonly set at 0.05, used to determine whether to reject the null hypothesis.
Degrees of Freedom
A value calculated as the sample size minus two, used in statistical tests to account for sample variability.
Test Statistic
A calculated value, such as t, summarizing sample data for comparison against a theoretical distribution in hypothesis testing.
P-value
A probability indicating how likely observed data would occur if the null hypothesis were true; smaller values suggest stronger evidence against the null.
Two-tailed Test
A hypothesis test evaluating the possibility of a relationship in both directions, not limited to positive or negative effects.
Excel Function
A built-in formula, such as CORREL or T.DIST.2T, used to perform statistical calculations efficiently within spreadsheet software.
Linear Correlation
A relationship where changes in one variable are associated with proportional changes in another, forming a straight-line pattern.
Sample Size
The number of observations or data points collected in a study, influencing statistical power and degrees of freedom.
 Back
Back
 05:40
05:40