Skip to main content
Statistics for Business
My Course
Learn
Exam Prep
AI Tutor
Study Guides
Flashcards
Explore
Try the app
My Course
Learn
Exam Prep
AI Tutor
Study Guides
Flashcards
Explore
Try the app
Back
Inferences for the Correlation Coefficient - Excel quiz
You can tap to flip the card.
What does the correlation coefficient r tell us about two variables?
You can tap to flip the card.
👆
What does the correlation coefficient r tell us about two variables?
It tells us the strength and direction of the linear relationship between the two variables.
Track progress
Control buttons has been changed to "navigation" mode.
1/15
Related flashcards
Related practice
Recommended videos
Inferences for the Correlation Coefficient - Excel definitions
Inferences for the Correlation Coefficient - Excel
13 Terms
11. Correlation
2 topics
15 problems
Chapter
David-Paige
Guided course
05:40
Inferences for Correlation Coefficient - Excel Example 1
51
views
1
rank
Guided course
05:45
Inferences for Correlation Coefficient - Excel
48
views
1
rank
Terms in this set (15)
Hide definitions
What does the correlation coefficient r tell us about two variables?
It tells us the strength and direction of the linear relationship between the two variables.
What is the null hypothesis when testing the population correlation coefficient ρ?
The null hypothesis is that ρ equals zero, meaning there is no linear correlation between the variables.
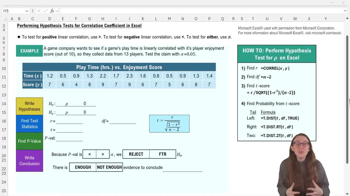
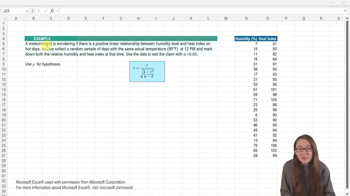
What symbol is used in the alternative hypothesis if we are testing for any linear correlation (not just positive or negative)?
We use the not equal to symbol (≠) in the alternative hypothesis.
How do you calculate the degrees of freedom for the correlation coefficient hypothesis test?
Degrees of freedom are calculated as the sample size n minus 2.
Which Excel function is used to calculate the sample correlation coefficient r?
The function is =CORREL(array1, array2).
What is the formula for the t statistic in testing the population correlation coefficient?
The formula is t = r * sqrt((n-2)/(1-r^2)).
Which Excel function is used to calculate the two-tailed p-value from the t statistic?
The function is =T.DIST.2T(t, degrees_freedom).
What does a p-value less than the alpha level indicate in this hypothesis test?
It indicates that we reject the null hypothesis and conclude there is significant linear correlation.
If the sample correlation coefficient r is close to zero, what does this suggest?
It suggests there is weak or no linear correlation between the variables.
What is the typical alpha level used in hypothesis testing for correlation?
A common alpha level is 0.05.
What does it mean if we reject the null hypothesis in a correlation test?
It means there is enough evidence to conclude that a linear correlation exists between the variables.
In the example, what was the sample size and the resulting degrees of freedom?
The sample size was 13, so the degrees of freedom were 11.
What was the approximate value of r in the example provided?
The value of r was approximately 0.74.
What was the calculated t score in the example?
The t score was about 3.68.
What was the p-value in the example, and what conclusion was drawn?
The p-value was about 0.004, which led to rejecting the null hypothesis and concluding a significant linear correlation.
 BackBack
 05:40
05:40