Textbook Question
Explain why or why not Determine whether the following statements are true and give an explanation or counterexample.
(a) If ƒ is symmetric about the line 𝓍 = 2 , then ∫₀⁴ ƒ(𝓍) d𝓍 = 2 ∫₀² ƒ(𝓍) d𝓍.
64
views

 Verified step by step guidance
 06:29
06:29 10:17 06:29
Explain why or why not Determine whether the following statements are true and give an explanation or counterexample.
(a) If ƒ is symmetric about the line 𝓍 = 2 , then ∫₀⁴ ƒ(𝓍) d𝓍 = 2 ∫₀² ƒ(𝓍) d𝓍.
Mass from density A thin 10-cm rod is made of an alloy whose density varies along its length according to the function shown in the figure. Assume density is measured in units of g/cm. In Chapter 6, we show that the mass of the rod is the area under the density curve.
(a) Find the mass of the left half of the rod (0 ≤ x ≤ 5) .
Approximating areas Estimate the area of the region bounded by the graph of ƒ(𝓍) = x² + 2 and the x-axis on [0, 2] in the following ways.
(a) Divide [0, 2] into n = 4 subintervals and approximate the area of the region using a left Riemann sum. Illustrate the solution geometrically.
Use Table 5.6 to evaluate the following indefinite integrals.
(a) ∫ e¹⁰ˣ d𝓍
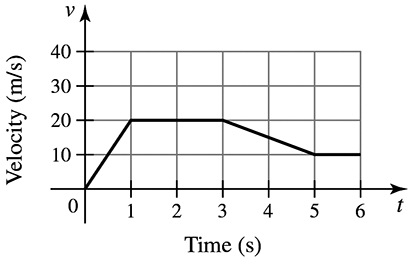
Free fall On October 14, 2012, Felix Baumgartner stepped off a balloon capsule at an altitude of almost 39 km above Earth’s surface and began his free fall. His velocity in m/s during the fall is given in the figure. It is claimed that Felix reached the speed of sound 34 seconds into his fall and that he continued to fall at supersonic speed for 30 seconds. (Source: http://www.redbullstratos.com)
(a) Divide the interval [34, 64] into n = 5 subintervals with the gridpoints x₀ = 34 , x₁ = 40 , x₂ = 46 , x₃ = 52 , x₄ = 58 , and x₅ = 64. Use left and right Riemann sums to estimate how far Felix fell while traveling at supersonic speed.
Area functions The graph of ƒ is shown in the figure. Let A(x) = ∫₀ˣ ƒ(t) dt and F(x) = ∫₂ˣ ƒ(t) dt be two area functions for ƒ. Evaluate the following area functions.
(a) A(2)