Find the area of the region R bounded by the graphs of , , and .
Table of contents
- 0. Functions7h 55m
- Introduction to Functions18m
- Piecewise Functions10m
- Properties of Functions9m
- Common Functions1h 8m
- Transformations5m
- Combining Functions27m
- Exponent rules32m
- Exponential Functions28m
- Logarithmic Functions24m
- Properties of Logarithms36m
- Exponential & Logarithmic Equations35m
- Introduction to Trigonometric Functions38m
- Graphs of Trigonometric Functions44m
- Trigonometric Identities47m
- Inverse Trigonometric Functions48m
- 1. Limits and Continuity2h 2m
- 2. Intro to Derivatives1h 33m
- 3. Techniques of Differentiation3h 18m
- 4. Applications of Derivatives2h 38m
- 5. Graphical Applications of Derivatives6h 2m
- 6. Derivatives of Inverse, Exponential, & Logarithmic Functions2h 37m
- 7. Antiderivatives & Indefinite Integrals1h 26m
- 8. Definite Integrals4h 44m
- 9. Graphical Applications of Integrals2h 27m
- 10. Physics Applications of Integrals 3h 16m
- 11. Integrals of Inverse, Exponential, & Logarithmic Functions2h 31m
- 12. Techniques of Integration7h 41m
- 13. Intro to Differential Equations2h 55m
- 14. Sequences & Series5h 36m
- 15. Power Series2h 19m
- 16. Parametric Equations & Polar Coordinates7h 58m
9. Graphical Applications of Integrals
Area Between Curves
Problem 5.3.66
Textbook Question
Area Find (i) the net area and (ii) the area of the following regions. Graph the function and indicate the region in question.
The region bounded by y = 6 cos 𝓍 and the 𝓍-axis between 𝓍 = ―π/2 and 𝓍 = π
 Verified step by step guidance
1
Step 1: Understand the problem. You are tasked with finding (i) the net area and (ii) the total area of the region bounded by the function y = 6 cos(𝓍) and the 𝓍-axis between 𝓍 = -π/2 and 𝓍 = π. The net area accounts for signed areas (positive above the 𝓍-axis and negative below), while the total area considers only the magnitude of the regions.
Step 2: Graph the function y = 6 cos(𝓍) over the interval [-π/2, π]. The cosine function oscillates between -1 and 1, and multiplying by 6 scales the amplitude to [-6, 6]. Identify where the function crosses the 𝓍-axis (i.e., where y = 0) within the interval. These points divide the region into subintervals where the function is either positive or negative.
Step 3: Set up the integral for the net area. The net area is calculated using the definite integral of y = 6 cos(𝓍) over the interval [-π/2, π]. Use the formula:
Step 4: Set up the integral for the total area. To find the total area, you need to integrate the absolute value of y = 6 cos(𝓍) over the interval [-π/2, π]. This requires splitting the integral into subintervals where the function is positive and negative, and then taking the absolute value of the function in the negative subinterval. Use the formula:
Step 5: Solve the integrals. For the net area, evaluate the definite integral of 6 cos(𝓍) over [-π/2, π]. For the total area, split the integral into subintervals where the function is positive and negative, and evaluate the absolute value of the function in the negative subinterval. Combine the results to find the total area. Ensure proper use of trigonometric identities and integration rules.
 Verified video answer for a similar problem:
This video solution was recommended by our tutors as helpful for the problem above
Video duration:
7mPlay a video:
Key Concepts
Here are the essential concepts you must grasp in order to answer the question correctly.
Definite Integral
The definite integral is a fundamental concept in calculus that represents the net area under a curve between two specified limits. It is calculated using the integral symbol and provides a way to quantify the accumulation of quantities, such as area, over an interval. In this context, it will be used to find the area between the curve y = 6 cos x and the x-axis from x = -π/2 to x = π.
Recommended video:

Definition of the Definite Integral
Net Area vs. Total Area
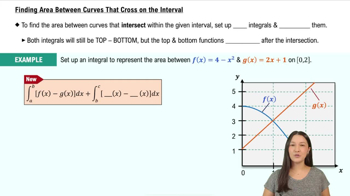
Net area refers to the signed area between a curve and the x-axis, where areas above the x-axis are positive and those below are negative. In contrast, total area considers all areas as positive, regardless of their position relative to the x-axis. Understanding this distinction is crucial for accurately calculating the areas in the given problem, especially since the cosine function oscillates above and below the x-axis.
Recommended video:

Finding Area Between Curves that Cross on the Interval
Graphing Trigonometric Functions
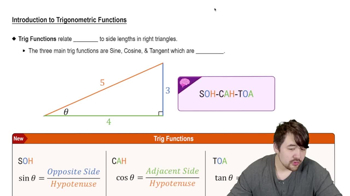
Graphing trigonometric functions, such as y = 6 cos x, involves plotting the function's values over a specified interval to visualize its behavior. This includes identifying key features like amplitude, period, and intercepts. For this problem, graphing the function will help in understanding the regions bounded by the curve and the x-axis, which is essential for determining both the net and total areas.
Recommended video:

Introduction to Trigonometric Functions

 5:23m
5:23mWatch next
Master Finding Area Between Curves on a Given Interval with a bite sized video explanation from Patrick
Start learningRelated Videos
Related Practice
Multiple Choice
39
views
