Suppose an object moves along a line at 15 m/s, for 0 ≤ t < 2 and at 25 m/s, for 2 ≤ t ≤ 5, where t is measured in seconds. Sketch the graph of the velocity function and find the displacement of the object for 0 ≤ t ≤ 5.
Verified step by step guidance
1
Step 1: Understand the problem. The velocity function is piecewise defined: v(t) = 15 m/s for 0 ≤ t < 2, and v(t) = 25 m/s for 2 ≤ t ≤ 5. Displacement is calculated as the integral of the velocity function over the given time interval.
Step 2: Sketch the graph of the velocity function. For 0 ≤ t < 2, draw a horizontal line at v(t) = 15 m/s. For 2 ≤ t ≤ 5, draw another horizontal line at v(t) = 25 m/s. Ensure the graph is piecewise continuous and clearly shows the change in velocity at t = 2.
Step 3: Set up the integral to calculate displacement. Displacement is the area under the velocity-time graph. Break the integral into two parts: ∫[0,2] v(t) dt and ∫[2,5] v(t) dt. Substitute the respective velocity values into each integral.
Step 4: Compute the first integral ∫[0,2] v(t) dt. Since v(t) = 15 m/s is constant over this interval, the integral simplifies to 15 × (2 - 0). This represents the displacement for the first segment of motion.
Step 5: Compute the second integral ∫[2,5] v(t) dt. Since v(t) = 25 m/s is constant over this interval, the integral simplifies to 25 × (5 - 2). Add the results of both integrals to find the total displacement over the interval 0 ≤ t ≤ 5.
Verified video answer for a similar problem:
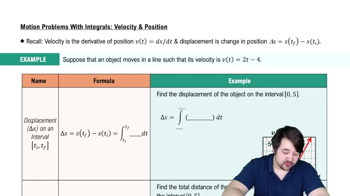
This video solution was recommended by our tutors as helpful for the problem above
Video duration:
5m
Play a video:
0 Comments
Key Concepts
Here are the essential concepts you must grasp in order to answer the question correctly.
Velocity Function
The velocity function describes the speed and direction of an object's motion over time. In this case, the object has two distinct velocity segments: 15 m/s for the first two seconds and 25 m/s for the next three seconds. Understanding how to represent these segments graphically is crucial for visualizing the object's motion.
Displacement is the total change in position of an object over a given time interval, calculated as the integral of the velocity function. It accounts for the direction of motion and can be found by summing the areas under the velocity graph for each segment. In this scenario, calculating displacement involves integrating the velocity over the specified time intervals.
Graphing piecewise functions involves plotting different expressions for different intervals of the independent variable. For this problem, the velocity function is piecewise defined, requiring separate graphs for the intervals 0 ≤ t < 2 and 2 ≤ t ≤ 5. Understanding how to accurately represent these segments is essential for visualizing the overall motion of the object.