Graph the functions in Exercises 13–22. What is the period of each function?
−cos 2πx
Verified step by step guidance
1
Identify the function to be graphed: \(-\cos(2\pi x)\). This is a cosine function with a negative sign, which means it is reflected over the x-axis.
Determine the amplitude of the function. The amplitude is the absolute value of the coefficient in front of the cosine function. Here, the amplitude is \(1\) because the coefficient is \(-1\).
Find the period of the function. The period of a cosine function \(\cos(bx)\) is given by \(\frac{2\pi}{b}\). In this case, \(b = 2\pi\), so the period is \(\frac{2\pi}{2\pi} = 1\).
Sketch the graph of the function. Start by plotting key points: the maximum, minimum, and intercepts within one period. Since the function is \(-\cos(2\pi x)\), it starts at a minimum point at \(x = 0\), reaches a maximum at \(x = 0.5\), and returns to a minimum at \(x = 1\).
Label the x-axis with the period and the y-axis with the amplitude. The graph should show one complete cycle from \(x = 0\) to \(x = 1\), with the curve starting and ending at the minimum value of \(-1\), peaking at \(1\) in the middle.
Verified video answer for a similar problem:
This video solution was recommended by our tutors as helpful for the problem above
Video duration:
7m
Play a video:
0 Comments
Key Concepts
Here are the essential concepts you must grasp in order to answer the question correctly.
Period of a Function
The period of a function is the length of the interval over which the function repeats itself. For trigonometric functions, the period can be determined from the coefficient of the variable inside the function. For example, the function f(x) = -cos(2πx) has a period of 1, as it completes one full cycle as x varies from 0 to 1.
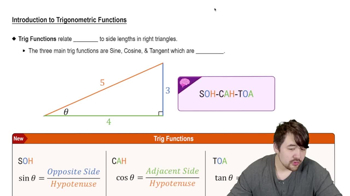
The cosine function is a fundamental trigonometric function defined as the ratio of the adjacent side to the hypotenuse in a right triangle. It is periodic, with a standard period of 2π. The function -cos(θ) reflects the cosine graph across the x-axis, affecting its amplitude but not its period.
Graphing trigonometric functions involves plotting their values over a specified interval. Key features to consider include amplitude, period, phase shift, and vertical shift. For the function -cos(2πx), the graph will oscillate between -1 and 1, repeating every 1 unit along the x-axis.

 Verified step by step guidance
 6:22
6:22