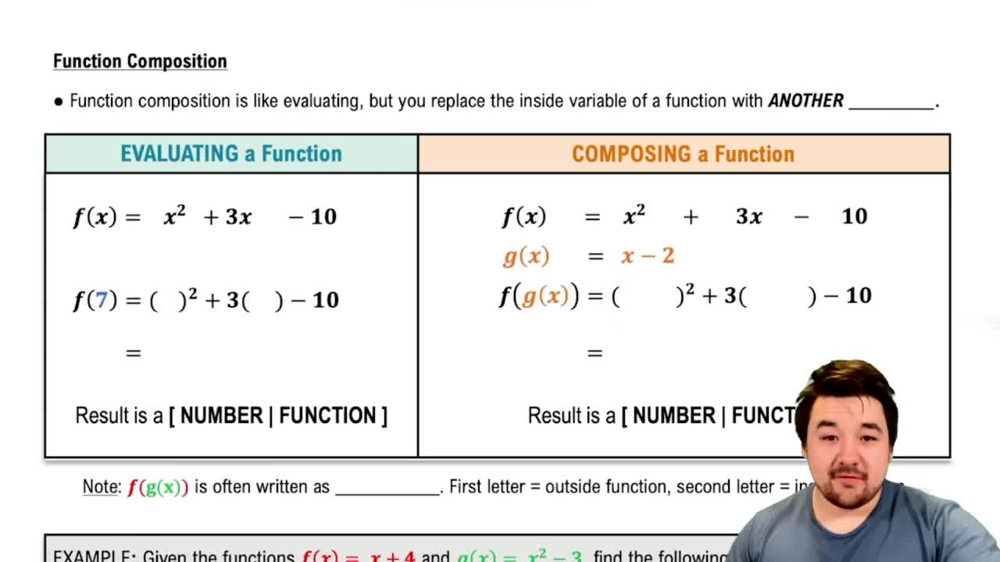
In Exercises 19–24, (a) Use the Leading Coefficient Test to determine the graph's end behavior. (b) Determine whether the graph has y-axis symmetry, origin symmetry, or neither. (c) Graph the function.
Verified step by step guidance
1
Identify the degree and leading coefficient of the polynomial function \(f(x) = x^3 - x^2 - 9x + 9\). The degree is the highest power of \(x\), which is 3, and the leading coefficient is the coefficient of \(x^3\), which is 1.
Apply the Leading Coefficient Test to determine the end behavior: Since the degree is odd (3) and the leading coefficient is positive (1), as \(x \to \infty\), \(f(x) \to \infty\), and as \(x \to -\infty\), \(f(x) \to -\infty\).
Check for symmetry by evaluating \(f(-x)\) and comparing it to \(f(x)\) and \(-f(x)\). Calculate \(f(-x) = (-x)^3 - (-x)^2 - 9(-x) + 9 = -x^3 - x^2 + 9x + 9\). Since \(f(-x) \neq f(x)\) and \(f(-x) \neq -f(x)\), the function has neither y-axis symmetry nor origin symmetry.
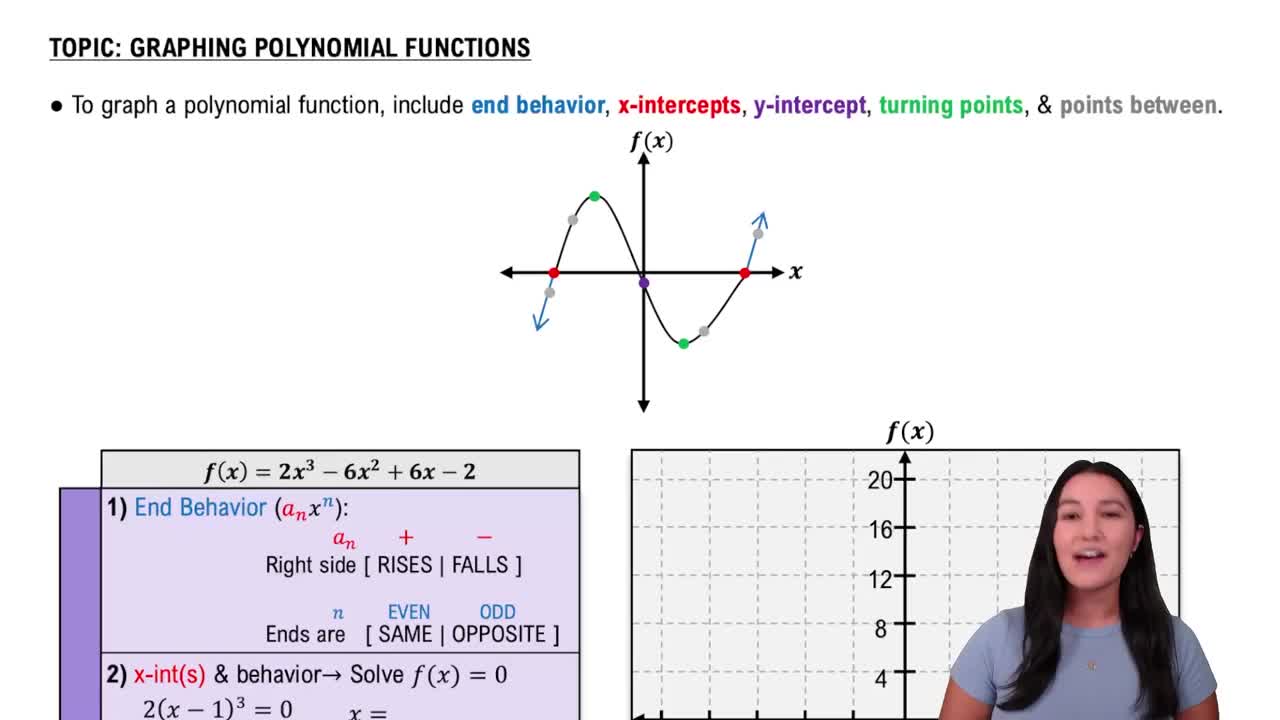
To graph the function, first find the x-intercepts by solving \(f(x) = 0\), which means solving \(x^3 - x^2 - 9x + 9 = 0\). Use factoring techniques or the Rational Root Theorem to find possible roots.
Next, find the y-intercept by evaluating \(f(0) = 9\). Plot the intercepts and use the end behavior and symmetry information to sketch the graph, noting the general shape of a cubic function with the given leading coefficient.
Verified video answer for a similar problem:
This video solution was recommended by our tutors as helpful for the problem above
Video duration:
5m
Play a video:
0 Comments
Key Concepts
Here are the essential concepts you must grasp in order to answer the question correctly.
Leading Coefficient Test
The Leading Coefficient Test helps determine the end behavior of a polynomial function by examining the degree and the leading coefficient. For a cubic function, if the leading coefficient is positive, the graph falls to the left and rises to the right; if negative, it rises to the left and falls to the right.
Symmetry in graphs can be about the y-axis, origin, or neither. A function is symmetric about the y-axis if f(-x) = f(x) (even function), symmetric about the origin if f(-x) = -f(x) (odd function), and neither if neither condition holds. Checking symmetry helps understand the graph's shape.
Graphing involves plotting key points such as intercepts, turning points, and using end behavior and symmetry to sketch the curve. For cubic polynomials, identifying roots and behavior between them is essential to accurately represent the function's shape.

 Verified step by step guidance
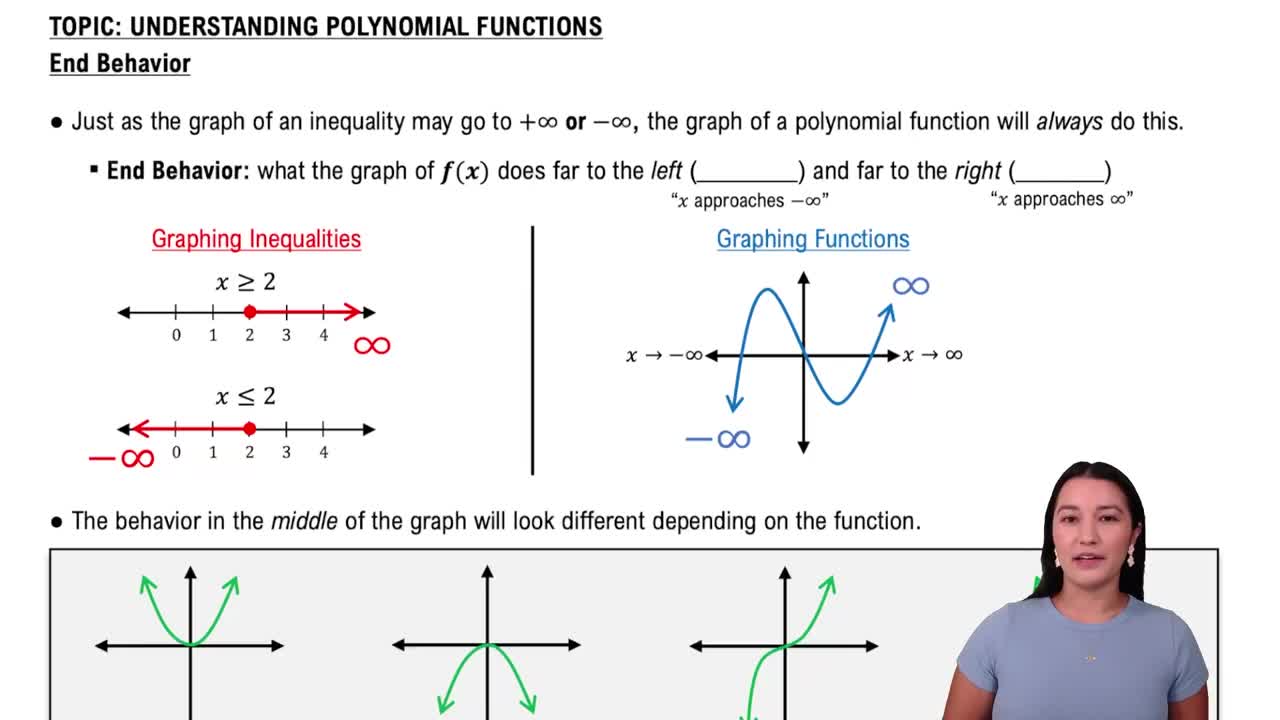
 06:08
06:08