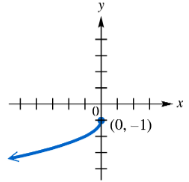
Here are the essential concepts you must grasp in order to answer the question correctly.
Continuity of Functions
A function is continuous at a point if the limit of the function as it approaches that point equals the function's value at that point. For a function to be continuous over an interval, it must be continuous at every point within that interval. This means there are no breaks, jumps, or holes in the graph of the function.
Recommended video:
Graphs of Common Functions
Intervals of Continuity
Intervals of continuity refer to the ranges of the independent variable (usually x) where a function remains continuous. These intervals can be open, closed, or half-open, depending on whether the endpoints are included. Identifying these intervals involves analyzing the function's behavior at critical points, such as where it is undefined or has discontinuities.
Recommended video:
Graphical Analysis
Graphical analysis involves examining the visual representation of a function to determine its properties, including continuity. By observing the graph, one can identify points where the function may not be continuous, such as holes or vertical asymptotes. The graph provides a clear indication of where the function behaves smoothly versus where it has interruptions.
Recommended video:
Introduction to Systems of Linear Equations