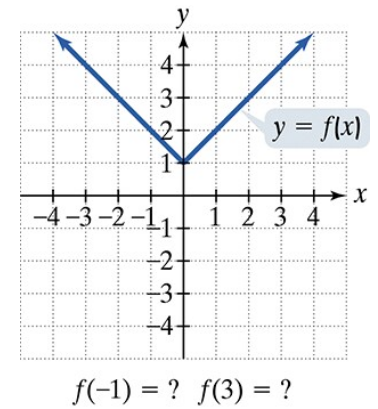
Use the graph to determine a.the x-intercepts, if any; b. the y-intercept, if any; and e. the missing function values, indicated by question marks, below each graph.
Verified step by step guidance
1
Step 1: Identify the x-intercepts by finding the points where the graph crosses the x-axis. These are points where the y-value is zero. From the graph, note the x-coordinates of these points.
Step 2: Identify the y-intercept by finding the point where the graph crosses the y-axis. This is the point where the x-value is zero. From the graph, note the y-coordinate of this point.
Step 3: Use the x-intercepts and y-intercept to write down the known points. For example, if the graph crosses the x-axis at (a, 0) and (b, 0), and the y-axis at (0, c), list these points clearly.
Step 4: To find the missing function values indicated by question marks, substitute the given x-values into the function (if known) or use the graph to estimate the corresponding y-values.
Step 5: Summarize the intercepts and the missing function values clearly, ensuring you have identified all points where the graph intersects the axes and filled in the missing values based on the graph.
Verified video answer for a similar problem:
This video solution was recommended by our tutors as helpful for the problem above
Video duration:
1m
Play a video:
0 Comments
Key Concepts
Here are the essential concepts you must grasp in order to answer the question correctly.
X-Intercepts
X-intercepts are the points where the graph of a function crosses the x-axis. At these points, the y-value is zero. Identifying x-intercepts helps solve equations by setting the function equal to zero and finding the corresponding x-values.
The y-intercept is the point where the graph crosses the y-axis, meaning the x-value is zero. It represents the output of the function when the input is zero, providing a starting value for the function on the graph.
Determining missing function values involves locating points on the graph and interpreting their coordinates. By understanding the shape and key points of the graph, one can estimate or find exact values of the function for given inputs.

 Verified step by step guidance
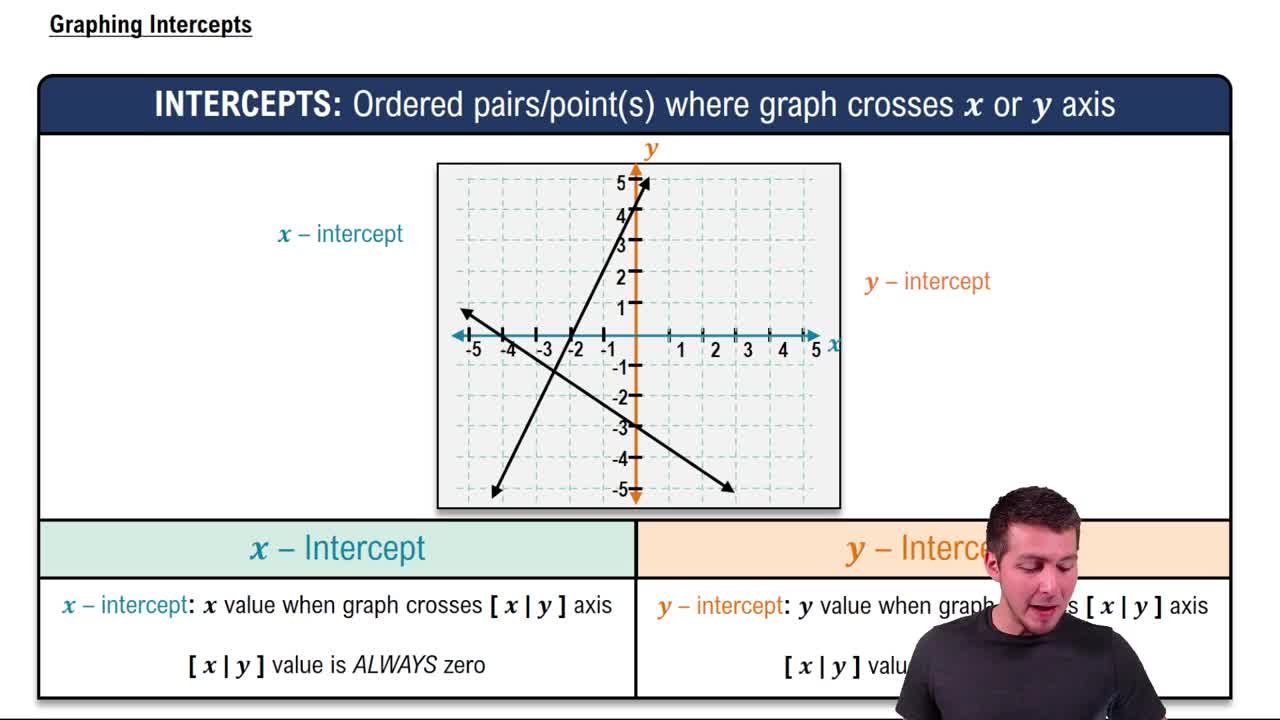
 04:08
04:08