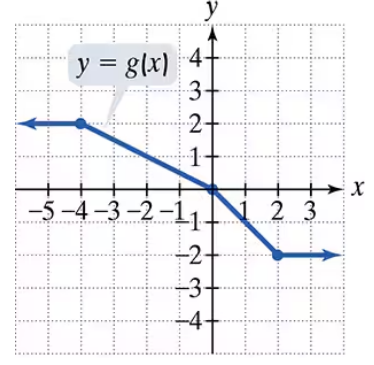
Use the graph of g to solve Exercises 71–76. For what value of x is g(x) = 1?
Verified step by step guidance
1
Identify the horizontal line on the graph where the function value is \(g(x) = 1\). This means we are looking for points on the graph where the y-coordinate is 1.
Look across the graph to find all points where the graph intersects the horizontal line \(y = 1\).
Note the x-coordinates of these intersection points, as these are the values of \(x\) for which \(g(x) = 1\).
Write down the x-values corresponding to these points. These are the solutions to the equation \(g(x) = 1\).
Verify by checking the graph that at these x-values, the function's output is indeed 1.
Verified video answer for a similar problem:
This video solution was recommended by our tutors as helpful for the problem above
Video duration:
1m
Play a video:
0 Comments
Key Concepts
Here are the essential concepts you must grasp in order to answer the question correctly.
Understanding Function Notation
Function notation, such as g(x), represents the output value of a function g for a given input x. It is essential to interpret g(x) = 1 as finding the x-values where the function's output equals 1.
To solve for g(x) = 1 using a graph, locate the horizontal line y = 1 and identify the points where the graph of g intersects this line. The x-coordinates of these intersection points are the solutions.
Each point on a graph is represented as (x, y), where x is the input and y is the output. Understanding how to read these coordinates allows you to determine the input values corresponding to a specific output, such as g(x) = 1.

 Verified step by step guidance
 06:08
06:08