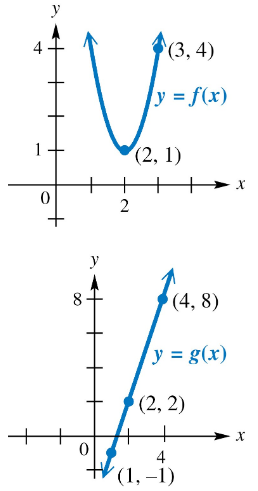
The graphs of two functions ƒ and g are shown in the figures. Find .
Verified step by step guidance
1
Understand that (ƒ∘g)(2) means ƒ(g(2)), which is the composition of functions where you first find g(2) and then use that result as the input for ƒ.
Look at the graph of g(x) to find the value of g(2). Since the graph shows points for g(x), estimate or identify the y-value when x = 2 on the g(x) curve.
Once you find g(2), note this value as the input for the function ƒ. So, you will need to find ƒ at this new input value.
Use the graph or information about ƒ to find ƒ(g(2)). This means locating the point on the ƒ graph where the x-value is equal to g(2) and then reading the corresponding y-value.
The y-value you find in the previous step is the value of (ƒ∘g)(2). This completes the composition evaluation.
Verified video answer for a similar problem:
This video solution was recommended by our tutors as helpful for the problem above
Video duration:
3m
Play a video:
0 Comments
Key Concepts
Here are the essential concepts you must grasp in order to answer the question correctly.
Function Composition
Function composition involves applying one function to the result of another, denoted as (ƒ∘g)(x) = ƒ(g(x)). To find (ƒ∘g)(2), first evaluate g(2), then use that output as the input for ƒ. This process combines two functions into a single operation.
To evaluate functions from a graph, locate the input value on the x-axis and find the corresponding y-value on the curve. For example, to find g(2), find x=2 on the graph of g and read the y-value. This skill is essential when function formulas are not given explicitly.
The graph of g(x) is a parabola, a common shape for quadratic functions. Recognizing the shape helps predict behavior such as symmetry and minimum or maximum points. Knowing key points like (1, -6) and (5, 10) aids in estimating values for inputs like x=2.

 Verified step by step guidance
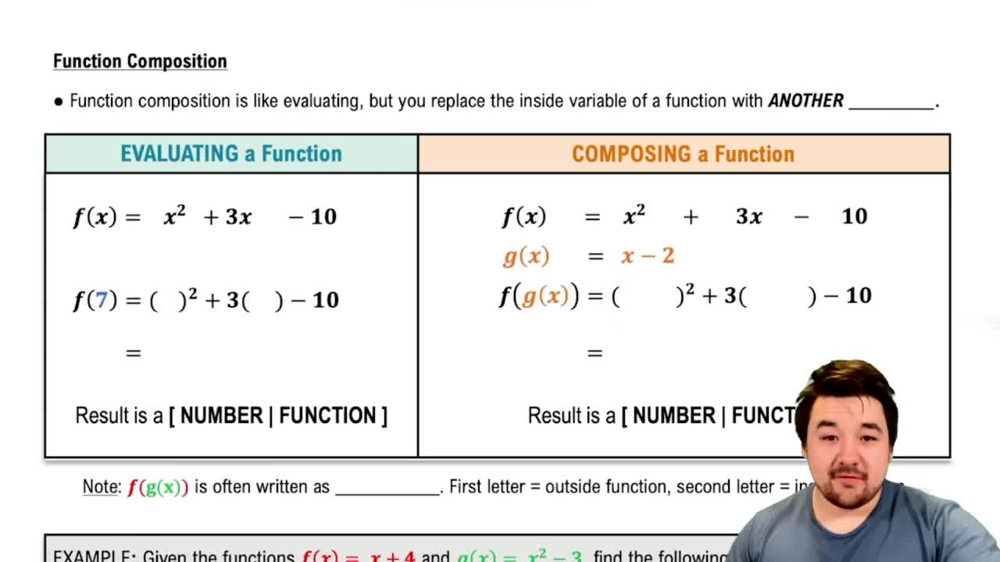
 4:56
4:56