Textbook Question
Find the coordinates of the vertex for the parabola defined by the given quadratic function. f(x)=−2(x+1)2+5
1105
views

 b.
b. 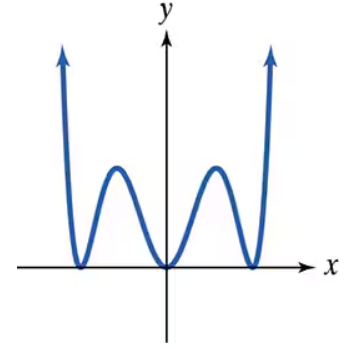 c.
c. 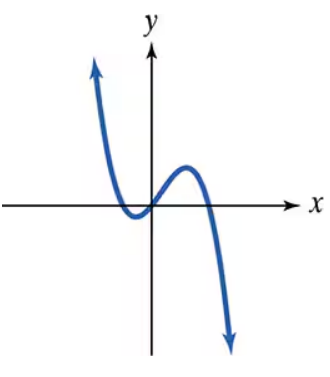 d.
d. 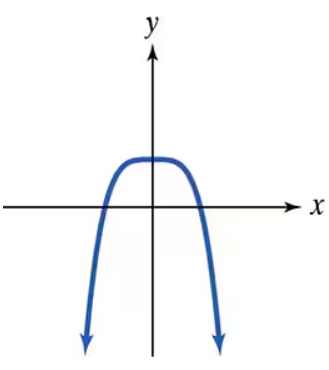
 Verified step by step guidance
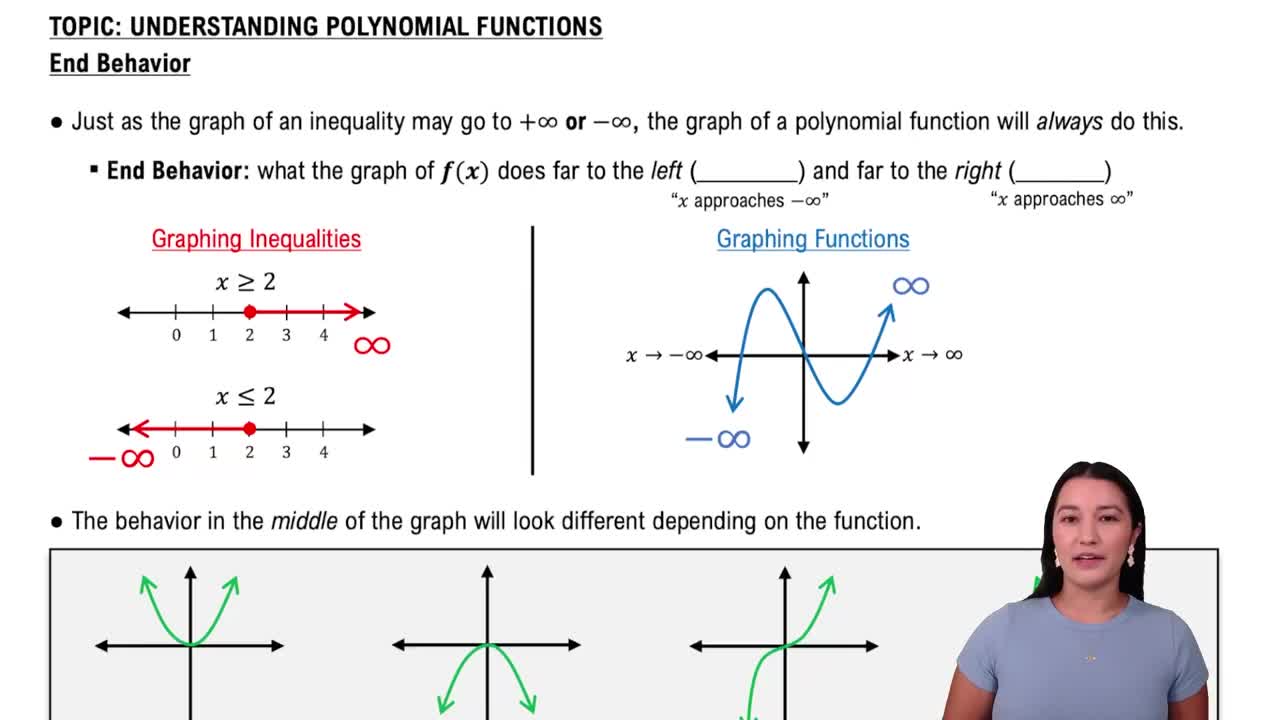
 06:08 06:08
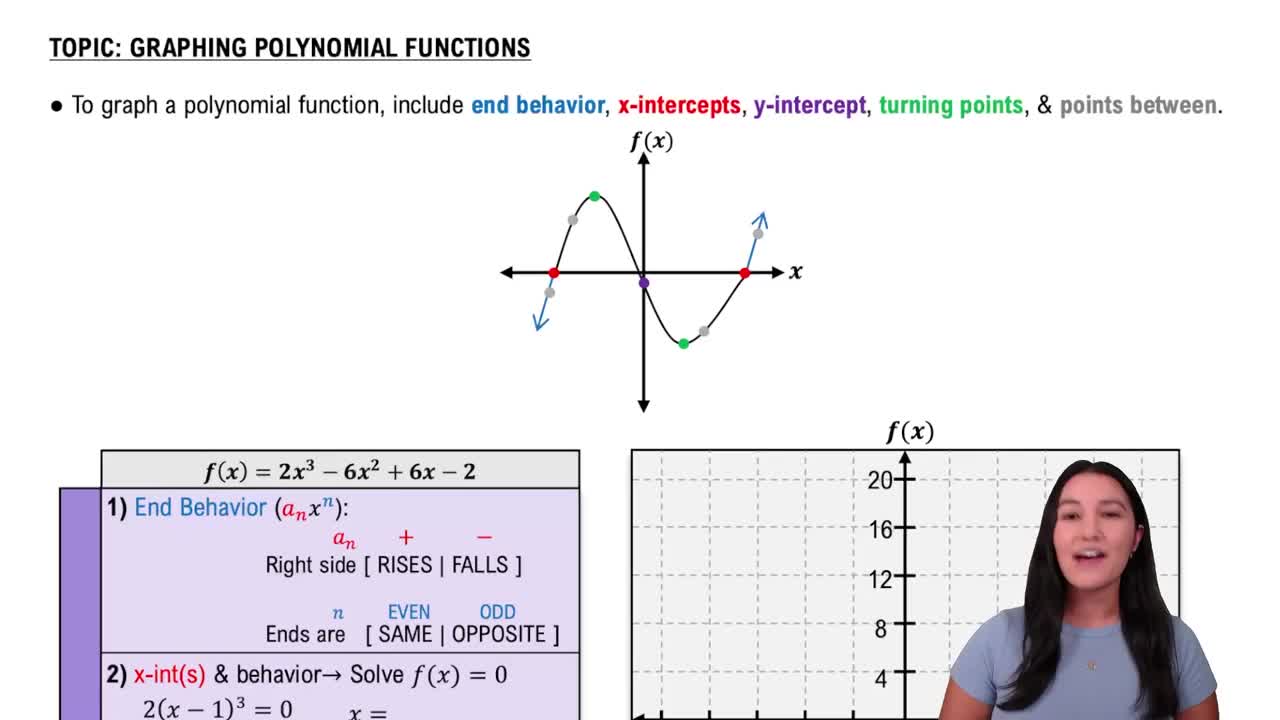 05:25
05:25Find the coordinates of the vertex for the parabola defined by the given quadratic function. f(x)=−2(x+1)2+5
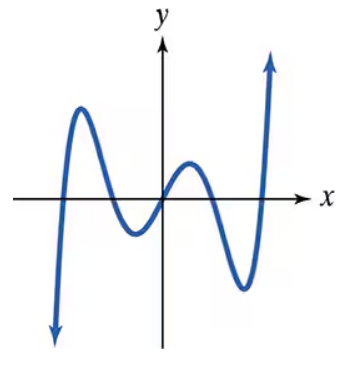
Determine which functions are polynomial functions. For those that are, identify the degree.
In Exercises 1–16, divide using long division. State the quotient, and the remainder, r(x). (3x2−2x+5)/(x−3)
Use the graph of the rational function in the figure shown to complete each statement in Exercises 9–14.
As ______
In Exercises 9–16, a) List all possible rational zeros. b) Use synthetic division to test the possible rational zeros and find an actual zero. c) Use the quotient from part (b) to find the remaining zeros of the polynomial function. f(x)=x3−2x2−11x+12
Use the four-step procedure for solving variation problems given on page 447 to solve Exercises 1–10. y varies jointly as a and b and inversely as the square root of c. y = 12 when a = 3, b = 2, and c = 25. Find y when a = 5, b = 3 and c = 9.