Textbook Question
Define linkage disequilibrium. What is the physical basis of linkage, and what causes linkage equilibrium? Explain how crossing over eliminates linkage disequilibrium.
796
views

 Verified step by step guidance
 07:33
07:33 10:48
10:48 03:51
03:51Define linkage disequilibrium. What is the physical basis of linkage, and what causes linkage equilibrium? Explain how crossing over eliminates linkage disequilibrium.
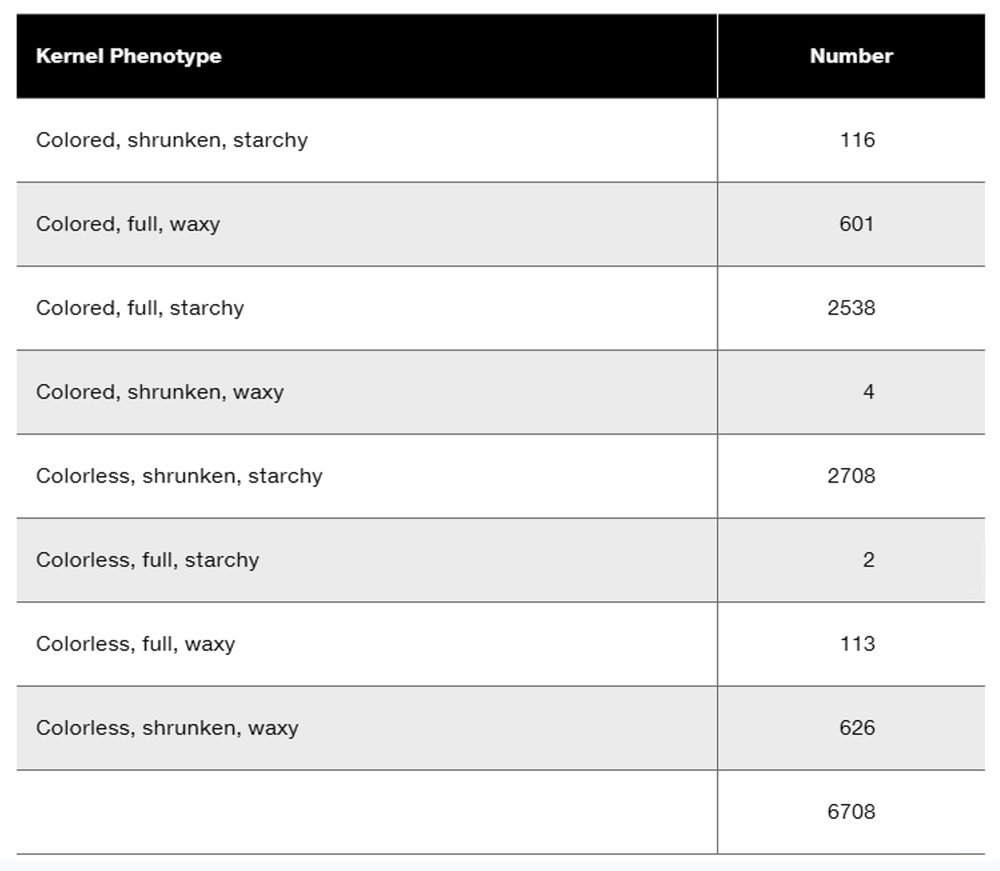
Researchers cross a corn plant that is pure-breeding for the dominant traits colored aleurone (C1), full kernel (Sh), and waxy endosperm (Wx) to a pure-breeding plant with the recessive traits colorless aleurone (c1), shrunken kernel (sh), and starchy (wx). The resulting F₁ plants were crossed to pure-breeding colorless, shrunken, starchy plants. Counting the kernels from about 30 ears of corn yields the following data.
Calculate the recombination frequencies between the gene pairs.
On the Drosophila X chromosome, the dominant allele y⁺ produces gray body color and the recessive allele y produces yellow body. This gene is linked to one controlling full eye shape by a dominant allele lz⁺ and lozenge eye shape with a recessive allele lz. These genes recombine with a frequency of approximately 28%. The Lz gene is linked to gene F controlling bristle form, where the dominant phenotype is long bristles and the recessive one is forked bristles. The Lz and F genes recombine with a frequency of approximately 32%.
Using any genotypes you choose, design two separate crosses, one to test recombination between genes Y and Lz and the second between genes Lz and F. Assume 1000 progeny are produced by each cross, and give the number of progeny in each outcome category. (In setting up your crosses, remember that Drosophila males do not undergo recombination.)
On the Drosophila X chromosome, the dominant allele y⁺ produces gray body color and the recessive allele y produces yellow body. This gene is linked to one controlling full eye shape by a dominant allele lz⁺ and lozenge eye shape with a recessive allele lz. These genes recombine with a frequency of approximately 28%. The Lz gene is linked to gene F controlling bristle form, where the dominant phenotype is long bristles and the recessive one is forked bristles. The Lz and F genes recombine with a frequency of approximately 32%.
Can any cross reveal genetic linkage between gene Y and gene F? Why or why not?
Researchers cross a corn plant that is pure-breeding for the dominant traits colored aleurone (C1), full kernel (Sh), and waxy endosperm (Wx) to a pure-breeding plant with the recessive traits colorless aleurone (c1), shrunken kernel (sh), and starchy (wx). The resulting F₁ plants were crossed to pure-breeding colorless, shrunken, starchy plants. Counting the kernels from about 30 ears of corn yields the following data.
Perform a chi-square test to determine if these data show significant deviation from the expected phenotype distribution.
Researchers cross a corn plant that is pure-breeding for the dominant traits colored aleurone (C1), full kernel (Sh), and waxy endosperm (Wx) to a pure-breeding plant with the recessive traits colorless aleurone (c1), shrunken kernel (sh), and starchy (wx). The resulting F₁ plants were crossed to pure-breeding colorless, shrunken, starchy plants. Counting the kernels from about 30 ears of corn yields the following data.
What is the order of these genes in corn?