Define linkage disequilibrium. What is the physical basis of linkage, and what causes linkage equilibrium? Explain how crossing over eliminates linkage disequilibrium.
Table of contents
- 1. Introduction to Genetics51m
- 2. Mendel's Laws of Inheritance3h 37m
- 3. Extensions to Mendelian Inheritance2h 41m
- 4. Genetic Mapping and Linkage2h 28m
- 5. Genetics of Bacteria and Viruses1h 21m
- 6. Chromosomal Variation1h 48m
- 7. DNA and Chromosome Structure56m
- 8. DNA Replication1h 10m
- 9. Mitosis and Meiosis1h 34m
- 10. Transcription1h 0m
- 11. Translation58m
- 12. Gene Regulation in Prokaryotes1h 19m
- 13. Gene Regulation in Eukaryotes44m
- 14. Genetic Control of Development44m
- 15. Genomes and Genomics1h 50m
- 16. Transposable Elements47m
- 17. Mutation, Repair, and Recombination1h 6m
- 18. Molecular Genetic Tools19m
- 19. Cancer Genetics29m
- 20. Quantitative Genetics1h 26m
- 21. Population Genetics50m
- 22. Evolutionary Genetics29m
4. Genetic Mapping and Linkage
Chi Square and Linkage
Problem 15c
Textbook Question
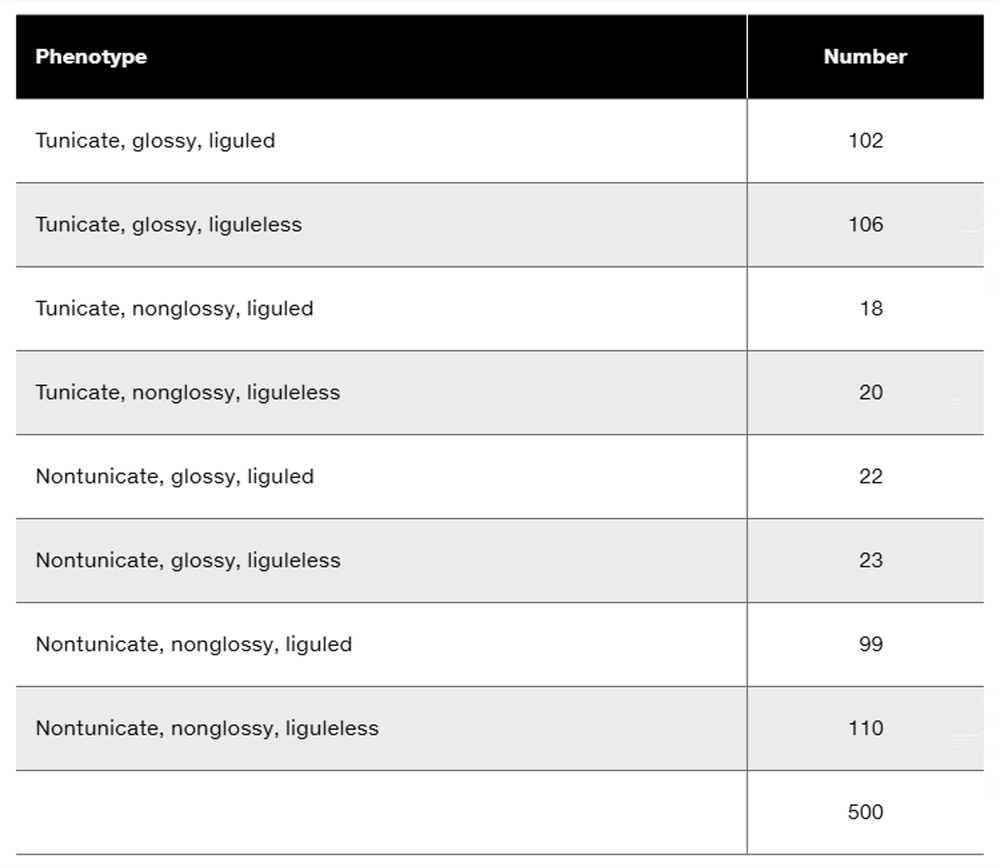
Three dominant traits of corn seedlings, tunicate seed (T-), glossy appearance (G-), and liguled stem (L-), are studied along with their recessive counterparts, nontunicate (tt), nonglossy (gg), and liguleless (ll). A trihybrid plant with the three dominant traits is crossed to a nontunicate, nonglossy, liguleless plant. Kernels on ears of progeny plants are scored for the traits, with the following results:

Using the gene symbols given above, write the genotypes of F₁ and F₂ plants.
 Verified step by step guidance
1
Step 1: Identify the parental genotypes. The trihybrid plant with dominant traits (T-, G-, L-) is crossed with a plant homozygous for recessive traits (tt, gg, ll). The F₁ generation will inherit one allele from each parent for each gene.
Step 2: Determine the F₁ genotype. The F₁ plants will be heterozygous for all three traits (Tt, Gg, Ll) because they inherit one dominant allele from the trihybrid parent and one recessive allele from the homozygous recessive parent.
Step 3: Analyze the F₂ generation. The F₁ plants are self-crossed, and the progeny (F₂ generation) will exhibit a phenotypic ratio based on independent assortment of the three genes. Each gene segregates independently, following Mendel's laws.
Step 4: Calculate the expected phenotypic ratios. For three independently assorting genes, the phenotypic ratio is determined by multiplying the ratios for each gene. Each gene follows a 3:1 ratio for dominant to recessive traits, resulting in a 27:9:9:9:3:3:3:1 ratio for the eight possible phenotypes.
Step 5: Compare observed data to expected ratios. Use the provided phenotypic counts to determine if the observed data aligns with the expected Mendelian ratios. This can be done using a chi-square test to assess the goodness of fit.
 Verified video answer for a similar problem:
This video solution was recommended by our tutors as helpful for the problem above
Video duration:
5mPlay a video:
Was this helpful?
Key Concepts
Here are the essential concepts you must grasp in order to answer the question correctly.
Dominant and Recessive Traits
In genetics, traits can be classified as dominant or recessive. Dominant traits are expressed in the phenotype even if only one copy of the allele is present, while recessive traits require two copies to be expressed. In the context of the corn seedlings, the dominant traits are tunicate seed (T-), glossy appearance (G-), and liguled stem (L-), while their recessive counterparts are nontunicate (tt), nonglossy (gg), and liguleless (ll).
Recommended video:
Guided course

Variations on Dominance
Punnett Square and Genetic Crosses
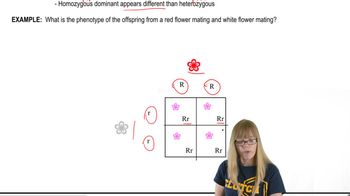
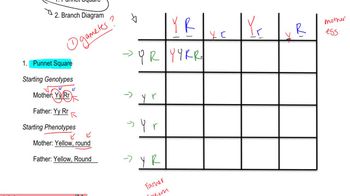
A Punnett square is a tool used to predict the genotypes and phenotypes of offspring from a genetic cross. By organizing the alleles from each parent, it allows for the visualization of potential combinations. In this case, crossing a trihybrid plant with three dominant traits to a plant with all recessive traits will help determine the expected ratios of the progeny’s traits.
Recommended video:
Guided course

Punnet Square
Phenotypic Ratios
Phenotypic ratios represent the relative frequencies of different phenotypes in the offspring resulting from a genetic cross. In the provided data, the counts of various phenotypes of corn seedlings can be analyzed to determine these ratios. Understanding these ratios is crucial for interpreting the results of the genetic cross and for predicting the genotypes of the F₁ and F₂ generations.
Recommended video:
Guided course

Mutations and Phenotypes

 7:33m
7:33mWatch next
Master Chi Square and Linkage with a bite sized video explanation from Kylia
Start learningRelated Videos
Related Practice
Textbook Question
629
views
