In this example, how many degrees of freedom should be used?
Table of contents
- 1. Introduction to Genetics51m
- 2. Mendel's Laws of Inheritance3h 37m
- 3. Extensions to Mendelian Inheritance2h 41m
- 4. Genetic Mapping and Linkage2h 28m
- 5. Genetics of Bacteria and Viruses1h 21m
- 6. Chromosomal Variation1h 48m
- 7. DNA and Chromosome Structure56m
- 8. DNA Replication1h 10m
- 9. Mitosis and Meiosis1h 34m
- 10. Transcription1h 0m
- 11. Translation58m
- 12. Gene Regulation in Prokaryotes1h 19m
- 13. Gene Regulation in Eukaryotes44m
- 14. Genetic Control of Development44m
- 15. Genomes and Genomics1h 50m
- 16. Transposable Elements47m
- 17. Mutation, Repair, and Recombination1h 6m
- 18. Molecular Genetic Tools19m
- 19. Cancer Genetics29m
- 20. Quantitative Genetics1h 26m
- 21. Population Genetics50m
- 22. Evolutionary Genetics29m
4. Genetic Mapping and Linkage
Chi Square and Linkage
Problem 15e
Textbook Question
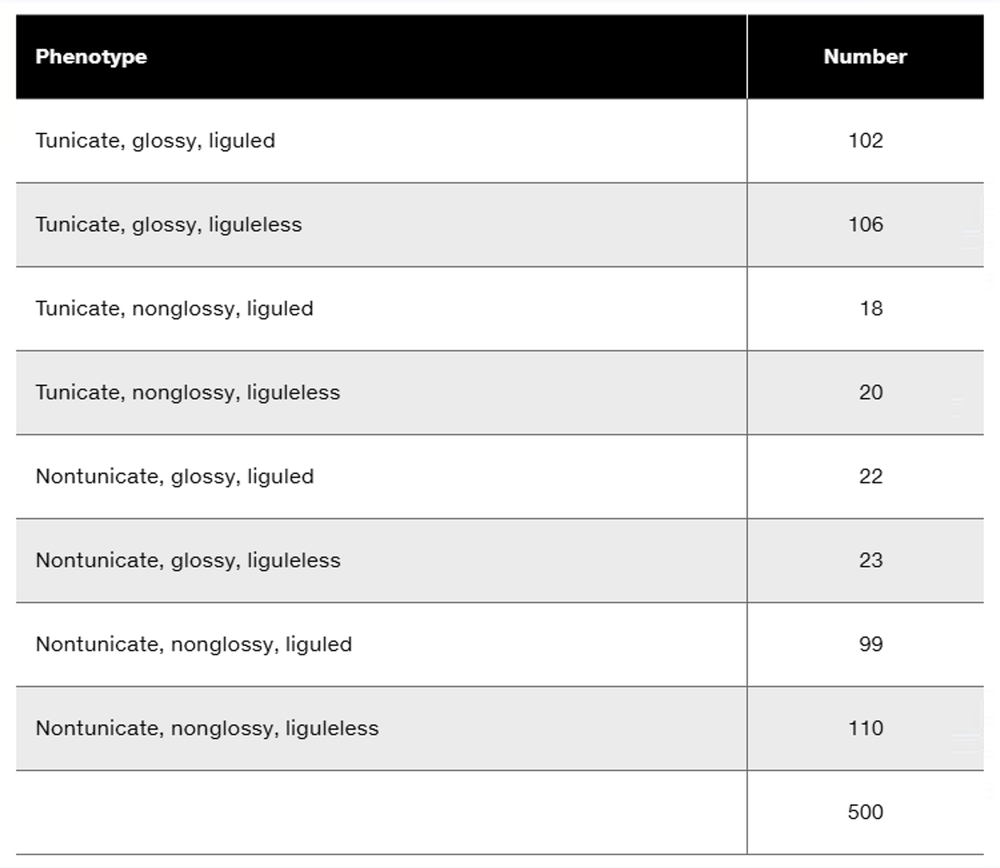
Three dominant traits of corn seedlings, tunicate seed (T-), glossy appearance (G-), and liguled stem (L-), are studied along with their recessive counterparts, nontunicate (tt), nonglossy (gg), and liguleless (ll). A trihybrid plant with the three dominant traits is crossed to a nontunicate, nonglossy, liguleless plant. Kernels on ears of progeny plants are scored for the traits, with the following results:

Could all three genes be carried on the same chromosome? Discuss why or why not.

1
Step 1: Begin by understanding the problem. The question asks whether the three genes (T, G, and L) are linked on the same chromosome or assort independently. To determine this, we need to analyze the phenotypic ratios of the progeny and compare them to expected ratios under independent assortment.
Step 2: Recall the concept of linkage. If genes are located on the same chromosome and are close together, they tend to be inherited together, resulting in non-Mendelian ratios. If they assort independently, the phenotypic ratios will follow Mendel's laws of independent assortment, typically a 1:1:1:1 ratio for a test cross.
Step 3: Analyze the phenotypic data provided. There are eight phenotypes listed with their respective numbers. Calculate the observed ratios for each phenotype by dividing the number of individuals with a given phenotype by the total number of progeny (500). This will help determine if the ratios deviate from the expected 1:1:1:1 ratio.
Step 4: Perform a chi-square test to statistically evaluate whether the observed ratios significantly deviate from the expected ratios under independent assortment. The formula for the chi-square test is: , where O is the observed frequency and E is the expected frequency. Calculate the chi-square value and compare it to the critical value for the degrees of freedom (df = number of phenotypic categories - 1).
Step 5: Interpret the results of the chi-square test. If the chi-square value is below the critical value, the null hypothesis (independent assortment) cannot be rejected, suggesting the genes assort independently. If the chi-square value exceeds the critical value, the null hypothesis is rejected, indicating linkage. Additionally, consider the possibility of recombination events if linkage is detected.

This video solution was recommended by our tutors as helpful for the problem above
Video duration:
4mPlay a video:
Was this helpful?
Key Concepts
Here are the essential concepts you must grasp in order to answer the question correctly.
Gene Linkage
Gene linkage refers to the tendency of genes located close to each other on the same chromosome to be inherited together during meiosis. If genes are linked, they do not assort independently, which can affect the expected phenotypic ratios in offspring. In this case, analyzing the ratios of the traits in the progeny can help determine if the genes for tunicate, glossy, and liguleless traits are linked or assorting independently.
Recommended video:
Guided course
Chi Square and Linkage
Independent Assortment
Independent assortment is a principle of genetics stating that alleles for different traits segregate independently of one another during gamete formation. This concept, proposed by Gregor Mendel, implies that the inheritance of one trait will not affect the inheritance of another if the genes are located on different chromosomes or are far apart on the same chromosome. The observed phenotypic ratios can be analyzed to see if they align with Mendelian expectations of independent assortment.
Recommended video:
Guided course
Gamete Genetics and Independent Assortment
Chi-Square Analysis
Chi-square analysis is a statistical method used to determine if there is a significant difference between observed and expected frequencies in genetic crosses. By applying this test to the phenotypic ratios of the progeny, one can assess whether the deviations from expected ratios are due to chance or suggest linkage between the genes. This analysis is crucial for interpreting the results of the cross and understanding the genetic relationships among the traits.
Recommended video:
Guided course
Chi Square Analysis
Watch next
Master Chi Square and Linkage with a bite sized video explanation from Kylia
Start learningRelated Videos
Related Practice
Multiple Choice
540
views
1
rank