The children of couples in which one partner has blood type O (genotype ii) and the other partner has blood type AB (genotype IᴬIᴮ) are studied. What is the expected concordance rate for blood type of DZ twins in this study? Explain why this answer is different from the answer to part (a).
Table of contents
- 1. Introduction to Genetics51m
- 2. Mendel's Laws of Inheritance3h 37m
- 3. Extensions to Mendelian Inheritance2h 41m
- 4. Genetic Mapping and Linkage2h 28m
- 5. Genetics of Bacteria and Viruses1h 21m
- 6. Chromosomal Variation1h 48m
- 7. DNA and Chromosome Structure56m
- 8. DNA Replication1h 10m
- 9. Mitosis and Meiosis1h 34m
- 10. Transcription1h 0m
- 11. Translation58m
- 12. Gene Regulation in Prokaryotes1h 19m
- 13. Gene Regulation in Eukaryotes44m
- 14. Genetic Control of Development44m
- 15. Genomes and Genomics1h 50m
- 16. Transposable Elements47m
- 17. Mutation, Repair, and Recombination1h 6m
- 18. Molecular Genetic Tools19m
- 19. Cancer Genetics29m
- 20. Quantitative Genetics1h 26m
- 21. Population Genetics50m
- 22. Evolutionary Genetics29m
20. Quantitative Genetics
Heritability
Problem 28a
Textbook Question
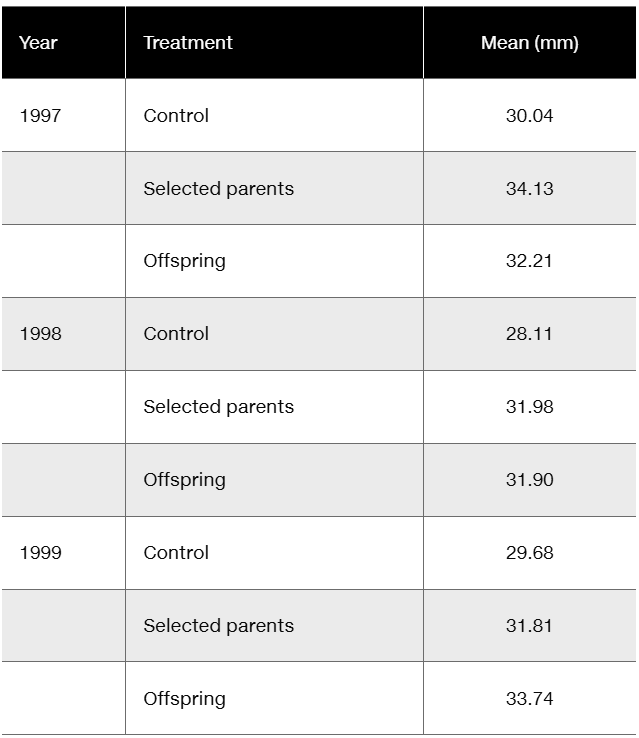
Floral traits in plants often play key roles in diversification, in that slight modifications of those traits, if genetically determined, may quickly lead to reproductive restrictions and evolution. Insight into genetic involvement in flower formation is often acquired through selection experiments that expose realized heritability. Lendvai and Levin (2003) conducted a series of artificial selection experiments on flower size (diameter) in Phlox drummondii. Data from their selection experiments are presented in the following table in modified form and content.

Considering that differences in control values represent year-to-year differences in greenhouse conditions, calculate (in mm) the average response to selection over the three-year period.

1
Step 1: Understand the concept of response to selection (R). It is calculated as the difference between the mean trait value of the offspring and the mean trait value of the control group for each year. The formula is: .
Step 2: For each year (1997, 1998, and 1999), calculate the response to selection using the data provided in the table. Subtract the control mean from the offspring mean for each year.
Step 3: Once the response to selection (R) is calculated for each year, sum up the values of R across the three years.
Step 4: Divide the total response to selection by the number of years (3) to calculate the average response to selection over the three-year period. The formula is: .
Step 5: Interpret the average response to selection value in the context of the experiment, noting how flower size evolved under artificial selection over the three-year period.

This video solution was recommended by our tutors as helpful for the problem above
Video duration:
2mPlay a video:
Was this helpful?
Key Concepts
Here are the essential concepts you must grasp in order to answer the question correctly.
Heritability
Heritability refers to the proportion of observed variation in a trait among individuals that can be attributed to genetic differences. It is a key concept in genetics, particularly in understanding how traits are passed from one generation to the next. In the context of the selection experiments, heritability helps determine how much of the variation in flower size is due to genetic factors versus environmental influences.
Recommended video:
Guided course
Calculating Heritability
Artificial Selection
Artificial selection is a process by which humans breed plants or animals for specific traits. In the case of the Phlox drummondii experiments, researchers selected for larger flower sizes over multiple generations. This method allows scientists to study the genetic basis of traits and observe how selection pressures can lead to changes in those traits over time.
Recommended video:
Guided course
Artificial Selection
Response to Selection
Response to selection is the change in the average trait value in a population due to selection over time. It is calculated by measuring the difference in trait values before and after selection. In the context of the question, calculating the average response to selection for flower size involves analyzing the data from the experiments to determine how much the average size of flowers has changed as a result of the selection process.
Recommended video:
Guided course
Artificial Selection
Watch next
Master Calculating Heritability with a bite sized video explanation from Kylia
Start learningRelated Videos
Related Practice
Textbook Question
286
views