Quadratic equations can be expressed in the form y = ax² + bx + c, where a ≠ 0. This form is essential because the x² term defines the equation as quadratic. The coefficients b and c can be zero, as seen in the simple example y = x², where a = 1 and both b and c are zero.
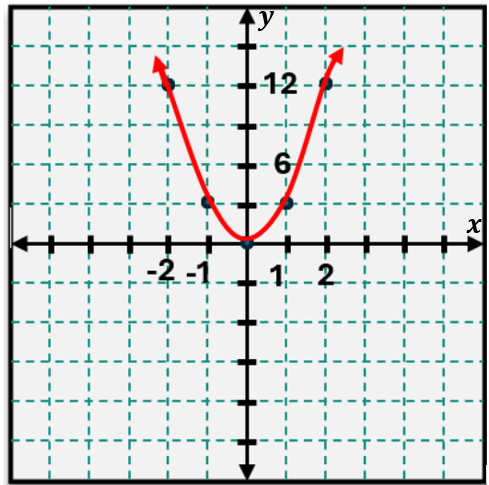
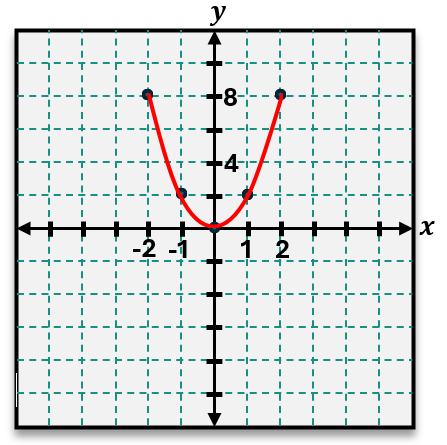
To graph a quadratic function, one effective method is to calculate and plot points by substituting various x values into the equation. For instance, plugging in values from -3 to 3 into y = x² yields corresponding y values of 9, 4, 1, 0, 1, 4, and 9. Plotting these points reveals a symmetric, smooth curve known as a parabola. This U-shaped curve is characteristic of all quadratic functions.
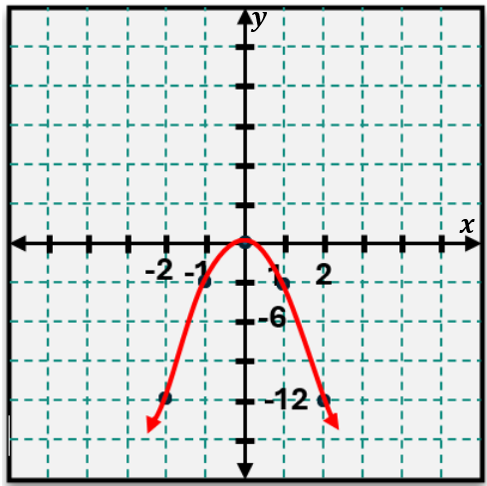
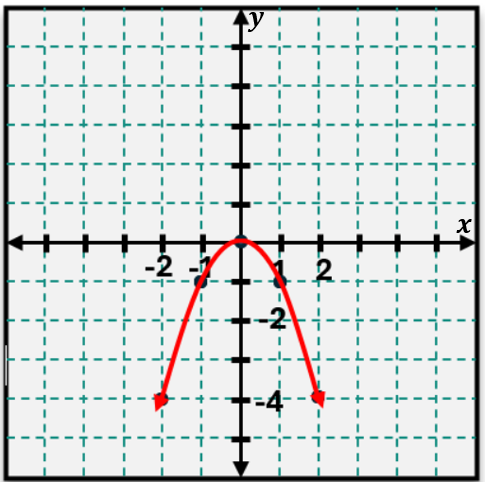
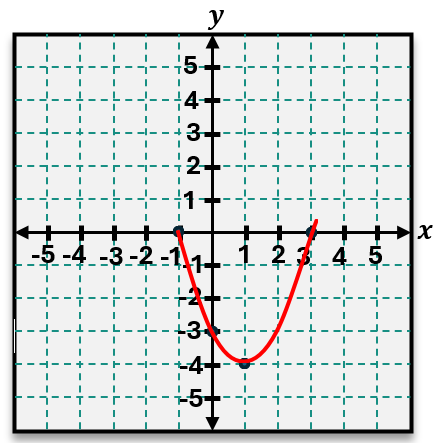
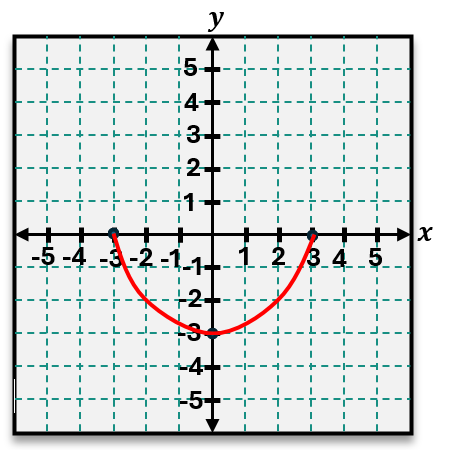
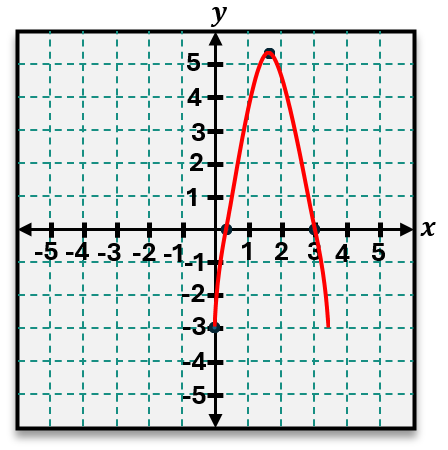
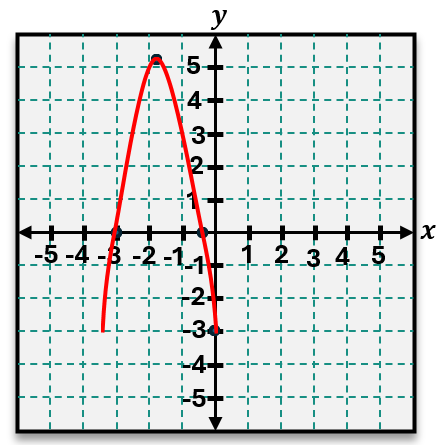
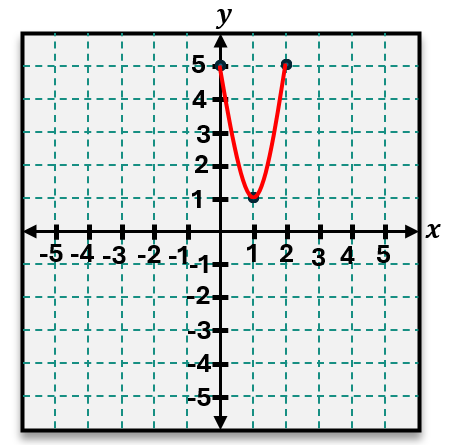
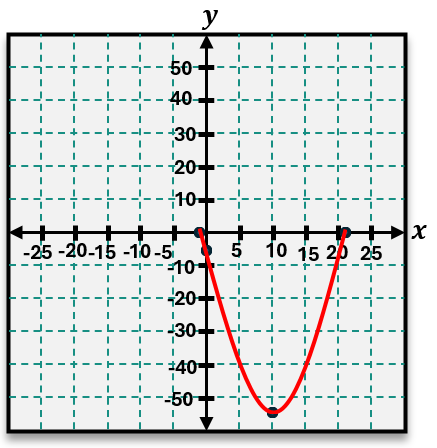
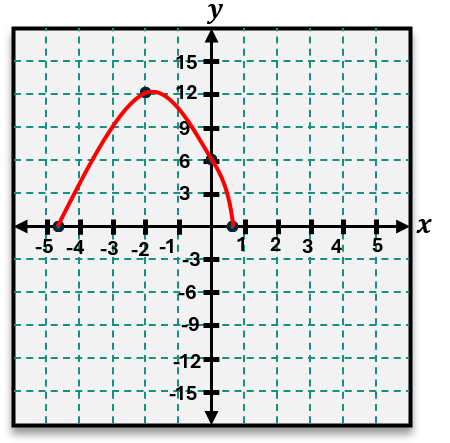
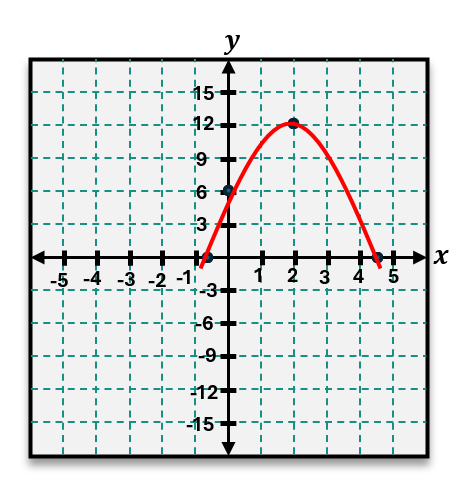
The direction in which the parabola opens depends on the sign of the coefficient a. If a is positive, the parabola opens upward, creating a minimum point. Conversely, if a is negative, as in y = -x², the parabola opens downward, forming a maximum point. This highest or lowest point on the parabola is called the vertex. For the basic forms y = x² and y = -x², the vertex is located at the origin (0, 0).
Another key feature of parabolas is the axis of symmetry, a vertical line that divides the parabola into two mirror-image halves. This line always passes through the vertex, and its equation corresponds to the x-coordinate of the vertex. For example, when the vertex is at (0, 0), the axis of symmetry is x = 0. Understanding the axis of symmetry is crucial for graphing quadratics efficiently, as it helps identify the vertex and ensures the graph is balanced.
While plotting points is a straightforward way to graph quadratic functions, it can be time-consuming and may not always reveal the vertex directly. Advanced methods, such as completing the square or using the vertex formula, allow for more precise graphing without extensive point plotting. These techniques leverage the quadratic formula and properties of parabolas to quickly determine key features like the vertex and axis of symmetry, streamlining the graphing process.