Join thousands of students who trust us to help them ace their exams!
Multiple Choice
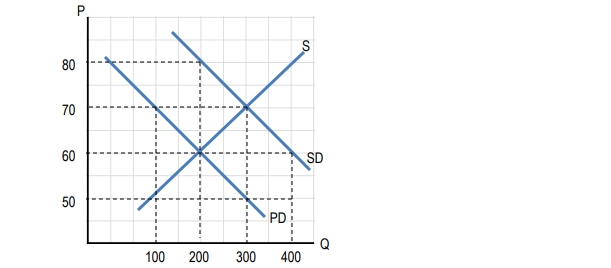
Use this diagram to answer the following questions. PD is private demand. SD is social demand. Based on the figure above, an unregulated market would produce:
A
100 units
B
200 units
C
300 units
D
400 units
0 Comments
Verified step by step guidance
1
Identify the curves on the graph: The graph shows two demand curves, PD (Private Demand) and SD (Social Demand), and one supply curve, S.
Understand the concept: In an unregulated market, the equilibrium quantity is determined by the intersection of the private demand curve (PD) and the supply curve (S).
Locate the intersection of PD and S: Look at the graph to find the point where the PD curve intersects with the S curve. This point represents the equilibrium in an unregulated market.
Determine the quantity at this intersection: From the intersection point, draw a vertical line down to the quantity axis (Q) to find the equilibrium quantity.
Compare the equilibrium quantity with the options: Check which of the given options (100 units, 200 units, 300 units, 400 units) matches the quantity determined from the graph.


 Verified step by step guidance
