Join thousands of students who trust us to help them ace their exams!
Multiple Choice
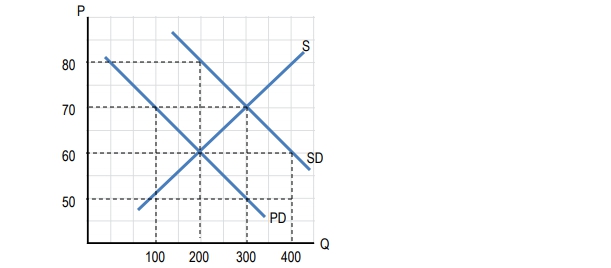
Use this diagram to answer the following questions. PD is private demand. SD is social demand. A per-unit _______________________ would result in the production of the socially optimal quantity.
A
Tax of \$10
B
Tax of \$20
C
Subsidy of \$10
D
Subsidy of \$20
0 Comments
Verified step by step guidance
1
Identify the intersection points of the supply curve (S) with the private demand curve (PD) and the social demand curve (SD) on the graph.
Note the quantity at which the private demand (PD) intersects with the supply (S). This is the quantity produced without any intervention.
Observe the quantity at which the social demand (SD) intersects with the supply (S). This is the socially optimal quantity.
Calculate the difference in price between the private demand (PD) and social demand (SD) at the socially optimal quantity. This difference represents the per-unit subsidy needed.
Conclude that a per-unit subsidy equal to the price difference calculated in the previous step would result in the production of the socially optimal quantity.


 Verified step by step guidance
