Join thousands of students who trust us to help them ace their exams!
Multiple Choice
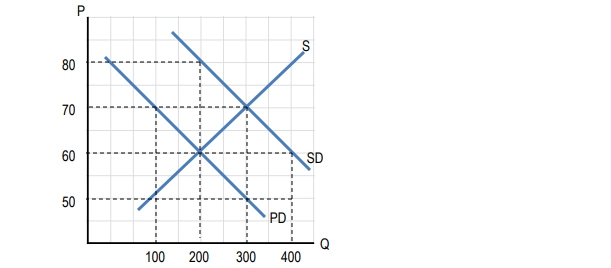
Use this diagram to answer the following questions. PD is private demand. SD is social demand. The figure above contains:
A
A positive externality
B
A negative externality
C
Both positive and negative externalities
D
No externalities
0 Comments
Verified step by step guidance
1
Identify the curves on the graph: The graph shows two demand curves, PD (Private Demand) and SD (Social Demand), and one supply curve, S.
Understand the concept of externalities: A positive externality occurs when the social demand (SD) is greater than the private demand (PD), indicating that the social benefits exceed the private benefits. A negative externality would be the opposite, where social demand is less than private demand.
Analyze the graph: Observe that the SD curve is above the PD curve at any given quantity. This suggests that the social value of the good is higher than the private value, indicating a positive externality.
Consider the implications: The presence of a positive externality means that the market equilibrium quantity (where PD intersects S) is less than the socially optimal quantity (where SD intersects S).
Conclude based on the analysis: Since the SD curve is consistently above the PD curve, the diagram represents a situation with a positive externality.


 Verified step by step guidance
