 Back
BackEnergy Metabolism: Pathways and Regulation in Human Nutrition
Study Guide - Smart Notes
 Tailored notes based on your materials, expanded with key definitions, examples, and context.
Energy Metabolism
Introduction to Metabolism
Metabolism refers to the sum of all chemical reactions occurring within the body. These reactions are organized into metabolic pathways, where compounds are converted into new forms to meet the body's energy and structural needs. Energy is stored in the chemical bonds of carbohydrates, proteins, and fats, and is released when these bonds are broken through metabolic reactions.
Aerobic reactions: Require oxygen and produce more ATP.
Anaerobic reactions: Occur without oxygen and yield less ATP.
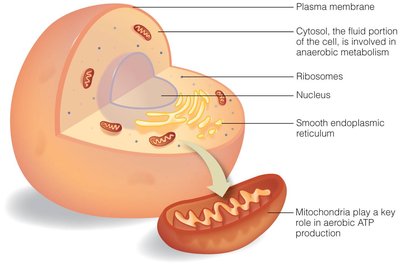
Cellular Sites of Metabolism
Metabolic processes occur within cells, which share a common structure but may perform specialized functions. The plasma membrane encloses the cell, while organelles such as mitochondria and the cytosol are key sites for metabolic reactions.
Mitochondria: Site of aerobic metabolism and ATP production.
Cytosol: Site of anaerobic metabolism.
The Liver's Role in Metabolism
The liver is the most metabolically active organ, responsible for metabolizing, storing, and distributing nutrients after absorption. It converts monosaccharides, amino acids, glycerol, and fatty acids into new compounds, energy, or storage forms such as triglycerides and glycogen.
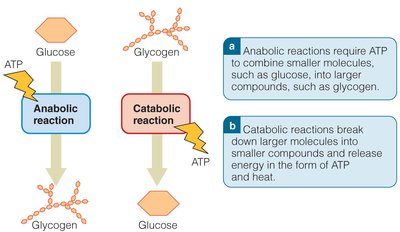
Anabolic and Catabolic Reactions
Metabolic pathways consist of anabolic and catabolic reactions:
Anabolic reactions: Absorb energy to build larger molecules from smaller ones (e.g., glucose to glycogen, amino acids to proteins).
Catabolic reactions: Release energy by breaking down large molecules into smaller ones (e.g., glycogen to glucose).
ATP: The Cell’s Energy Currency
ATP (adenosine triphosphate) is the direct energy source for cellular processes. Energy is stored in the bonds between phosphate groups and released when ATP is converted to ADP (adenosine diphosphate). The body must continually regenerate ATP from ADP and creatine phosphate, especially during high-intensity activities.
Major Metabolic Pathways
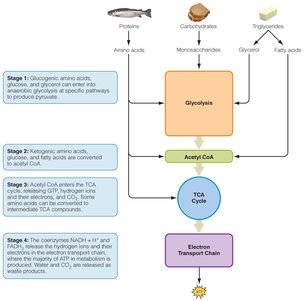
Overview of Macronutrient Metabolism
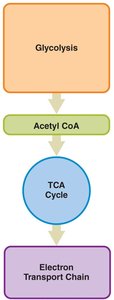
Carbohydrates, fats, and proteins are metabolized through a series of pathways to produce ATP. The four major stages are:
Glycolysis
Conversion of pyruvate to acetyl CoA
TCA (Krebs) cycle
Electron transport chain
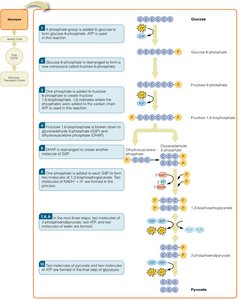
Glycolysis
Glycolysis is a 10-step anaerobic catabolic pathway that occurs in the cytosol. It converts one molecule of glucose (6 carbons) into two molecules of pyruvate (3 carbons each), producing a net gain of 2 ATP and 2 NADH. Glycolysis is essential for all cells, especially the brain and red blood cells.
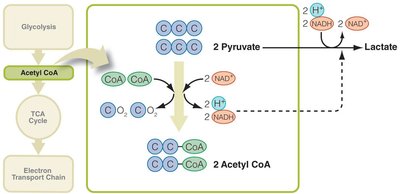
Pyruvate Metabolism
Pyruvate, the end product of glycolysis, can follow different fates depending on oxygen availability:
Aerobic conditions: Pyruvate enters mitochondria and is converted to acetyl CoA, which enters the TCA cycle.
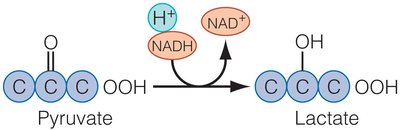
Anaerobic conditions: Pyruvate is reduced to lactate to prevent hydrogen ion buildup, especially during intense exercise.
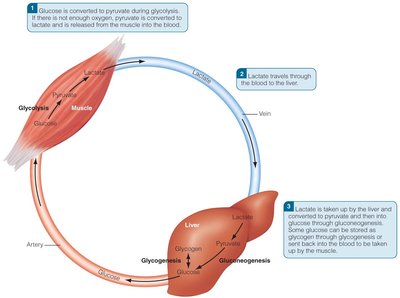
The Cori Cycle
The Cori cycle describes the recycling of lactate produced in muscles during anaerobic glycolysis. Lactate travels to the liver, where it is converted back to glucose, which can then be returned to the muscles.
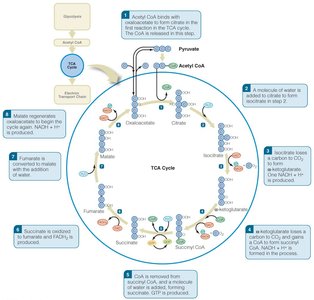
The TCA (Krebs) Cycle
The TCA cycle, located in the mitochondria, is the third stage of aerobic metabolism. Acetyl CoA enters the cycle, and through a series of reactions, high-energy electrons are transferred to NADH and FADH2. Each turn of the cycle produces 3 NADH, 1 FADH2, and 1 GTP (or ATP), and releases CO2 as a waste product.
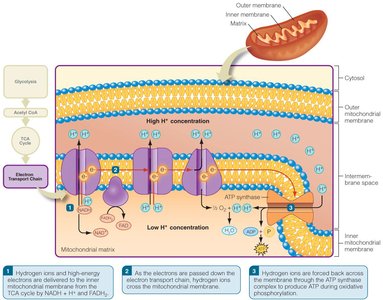
Electron Transport Chain and Oxidative Phosphorylation
The electron transport chain (ETC) is a series of protein complexes in the inner mitochondrial membrane. Electrons from NADH and FADH2 are passed along the chain, driving the production of ATP and water. The ETC produces about 90% of the ATP used by the body.
Regulation of Energy Storage and Use
Storage of Excess Nutrients
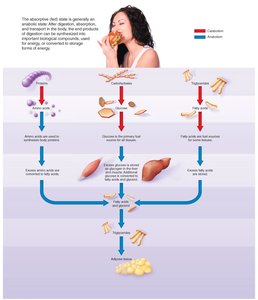
Excess glucose is stored as glycogen in the liver and muscles, but when glycogen stores are full, additional glucose is converted to triglycerides for long-term storage. Excess amino acids and dietary fat are also converted to triglycerides. Dietary fat is more efficiently stored as triglyceride than carbohydrate or protein.
Metabolic States: Absorptive, Postabsorptive, and Starvation
Absorptive state: Anabolic processes dominate, storing nutrients as glycogen and triglycerides.
Postabsorptive state: Catabolic processes release glucose and fatty acids from storage to maintain blood glucose levels.
Starvation: The body increases ketogenesis, producing ketone bodies from fatty acids to supply energy, especially to the brain.
Ketogenesis and Ketone Bodies
During prolonged fasting or low-carbohydrate intake, acetyl CoA accumulates and is converted into ketone bodies. These serve as an alternative energy source for the brain and other tissues. Excessive ketone production can lead to ketoacidosis, a dangerous condition that can impair heart function and cause coma or death.
Alcohol Metabolism
Pathways of Alcohol Metabolism
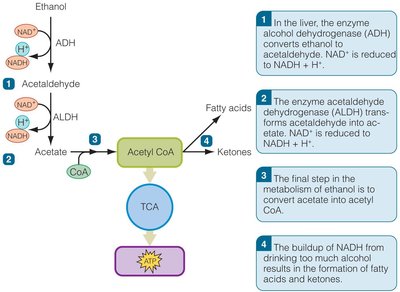
Alcohol provides 7 kcal/g and is absorbed directly through the stomach and intestines. The liver metabolizes alcohol primarily via the enzyme alcohol dehydrogenase (ADH), converting ethanol to acetaldehyde, then to acetate, and finally to acetyl CoA. Excess alcohol is converted to fat, and chronic intake can lead to fat accumulation in the liver (steatosis) and cirrhosis.
Alcohol is metabolized at a rate of about half an ounce per 1.5 hours.
Excess NADH from alcohol metabolism promotes fatty acid and ketone synthesis.
Summary Table: Major Metabolic Pathways
Pathway | Location | Major Substrates | Main Products | Oxygen Required? |
|---|---|---|---|---|
Glycolysis | Cytosol | Glucose | Pyruvate, ATP, NADH | No |
Pyruvate to Acetyl CoA | Mitochondria | Pyruvate | Acetyl CoA, CO2, NADH | Yes |
TCA Cycle | Mitochondria | Acetyl CoA | NADH, FADH2, GTP/ATP, CO2 | Yes |
Electron Transport Chain | Inner mitochondrial membrane | NADH, FADH2 | ATP, H2O | Yes |
Alcohol Metabolism | Liver | Ethanol | Acetyl CoA, NADH | Yes |
Key Equations
ATP hydrolysis:
Glycolysis (overall):
Pyruvate to lactate:
Alcohol metabolism (ADH pathway):
