 Back
BackIncome, Wealth, and Health Inequality in Canada: Social Determinants and Policy Implications
Study Guide - Smart Notes
 Tailored notes based on your materials, expanded with key definitions, examples, and context.
Income, Wealth, and Health Inequality in Canada
Materialist, Neo-Materialist, and Social Comparison Explanations
Understanding the social determinants of health (SDOH) requires examining how income and its distribution affect health outcomes. Several theoretical models explain these relationships:
Materialist Explanations: Focus on how material and social living conditions (such as income and stress) directly impact health. Chronic stress from adverse conditions can lead to increased allostatic load, harming physical and mental health.
Neo-Materialist Explanations: Emphasize the societal distribution of resources and social determinants, highlighting the role of public policy and collective investment in shaping health outcomes.
Social Comparison Theories: Highlight the psychosocial effects of social hierarchy, such as stress, envy, and jealousy, which can negatively affect health through perceived relative deprivation.
Life Course Perspective: Considers how health is shaped by latent, pathway, and cumulative effects of social and economic exposures throughout life.
Political Economy Models: Situate health determinants within broader systems of resource distribution, globalization, and the power of capital/wealth.
Trends in Income Inequality in Canada
Income inequality in Canada has increased over the past four decades, with significant implications for social stratification and health.
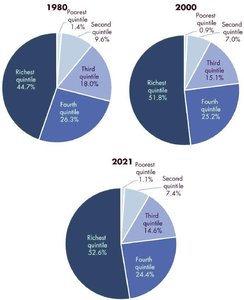
Growing Gap: The gap between mean and median income has widened, indicating that income gains are concentrated among the wealthiest.
Shrinking Middle Class: There is a documented erosion of the middle class, with growth in both the richest and poorest segments of society.
Broader Context: The erosion of the social safety net and increased reliance on market mechanisms have contributed to rising inequality.
Measuring Income: Mean vs. Median
Income can be measured in several ways, each with distinct implications for understanding inequality:
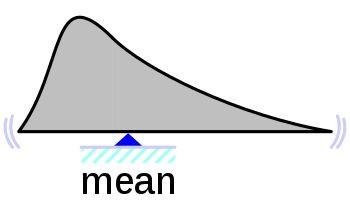
Mean Income: The average income, calculated as total income divided by the number of people. Sensitive to extreme values.
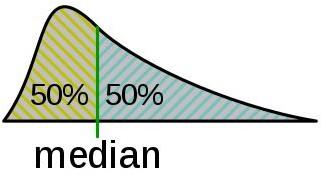
Median Income: The middle value, where half the population earns more and half earns less. Less affected by outliers.
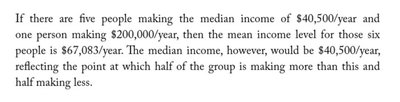
If there are five people making the median income of $40,500/year and one person making $200,000/year, then the mean income level for those six people is $67,083/year. The median income, however, would be $40,500/year, reflecting the point at which half of the group is making more than this and half making less.
Income Distribution: Deciles and Social Classes
Income is often analyzed by dividing the population into deciles (10% groups):
Bottom 10%: Often classified as "poor," frequently reliant on social assistance.
Second 10%: The "working poor," who may struggle to pay bills despite employment.
Top 10%: The "rich" or "very rich," who are the most affluent.
Middle Groups: Typically considered "middle class" or "working class," dependent on wages.

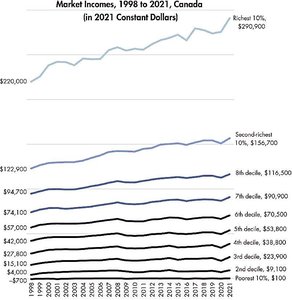
Trends in Market Income and Wealth Distribution
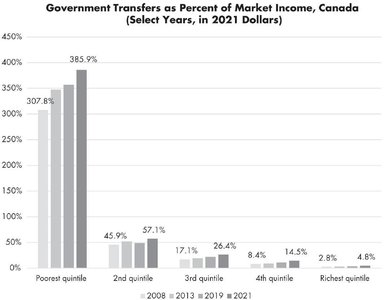
Market income (wages, salaries, self-employment, investments, pensions) is unevenly distributed in Canada, with the richest deciles experiencing the greatest gains over time.

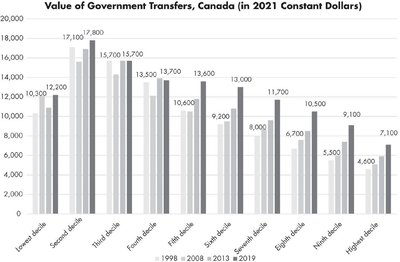
The Role of Government Transfers
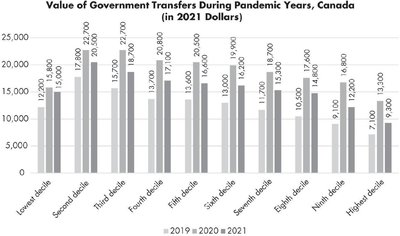
Governments attempt to reduce inequality through transfers such as pensions, welfare, Employment Insurance (EI), and emergency benefits (e.g., CERB during COVID-19). However, these transfers do not benefit all groups equally.
Transfers Narrow Inequality: All income groups receive some benefit, but the poorest decile often receives less than deciles 2–6.
Exclusions: Some groups (e.g., migrant workers, undocumented individuals, some Indigenous people, sex workers) are excluded from certain benefits.
After-Tax Income and Taxation
After-tax income is what individuals and households live on after accounting for government transfers and taxes. Progressive taxation means higher earners pay a larger share of their income in taxes, but Canada's top tax rates are lower than those in Scandinavian countries.
Formula:
Tax Rates: Richest decile pays ~$75,000 in taxes on average; poorest decile has a net tax rate of ~15.9%.
International Comparison: Scandinavian countries have higher top tax rates (Denmark 55.9%, Sweden 52%, Norway 38.2%) compared to Canada (25.1%).
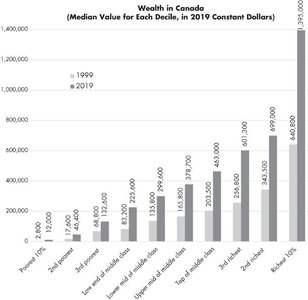
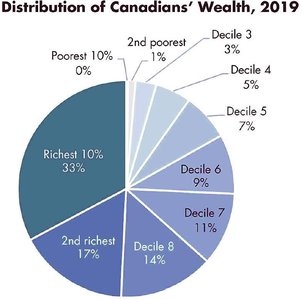
Wealth Inequality
Wealth (assets minus debts) is even more unequally distributed than income. The richest 10% of Canadians hold a disproportionate share of total wealth, while the poorest have little or none.
Measuring Inequality: The Gini Coefficient and Other Tools
Several statistical tools are used to measure income and wealth inequality:
Lorenz Curve: Graphs the cumulative share of income earned by cumulative percentages of the population.
Gini Index: A number between 0 (perfect equality) and 1 (perfect inequality) derived from the Lorenz curve.
Decile and Quintile Ratios: Compare the income of the richest and poorest segments.
Canada ranks mid-range among OECD countries for income inequality, with higher inequality than most Scandinavian countries.
Social Determinants of Health (SDOH) and Income
The conditions in which people are born, live, grow, work, and age—collectively known as the social determinants of health—are strongly influenced by income. Income is the most powerful SDOH, with a clear social gradient: lower income is associated with poorer health outcomes.
Access to Resources: Income determines access to housing, education, and health care.
Measurement Challenges: Hidden income and unmeasured wealth can obscure true inequality.
Health and Social Effects of High Inequality
Poorer Health: High inequality is linked to worse mental and physical health, reduced life expectancy, and increased crime rates.
Root Causes: Inequality is rooted in the uneven distribution of power, privilege, and prestige.
Income and Health: Theoretical Models
Behavioural Model: Health behaviours (diet, smoking, exercise) differ by income, but these "choices" are shaped by structural inequality.
Psychosocial Model: Stress from subordination and marginalization harms health by increasing susceptibility to disease.
Materialist Model: Income directly determines access to safety and care.
Lifecourse Model: Long-term accumulation of risks damages health over time.
Case Study: Income and Lung Cancer
Lung cancer is the leading cause of cancer death in Canada. Income-based disparities are evident in incidence, risk factors, stage at diagnosis, treatment, and survival:
Incidence: Low-income individuals are twice as likely to be diagnosed.
Risk Factors: Smoking rates are higher in low-income groups.
Diagnosis and Treatment: Poorer individuals are more likely to be diagnosed late and less likely to receive curative surgery.
Survival: Survival rates are lower for poorer patients.
Upstream strategies addressing root social and environmental factors are needed to reduce these inequities.
Policy and Practice Implications
Equity-First Approach: Health systems should co-create solutions with equity-deserving groups and include them in planning, implementation, and evaluation.
Limits of Downstream Interventions: Focusing solely on personal risk factors creates an illusion of progress; real change requires action on upstream determinants.
Groups Most Affected by Inequality
Indigenous Peoples and Racialized Persons: Face higher poverty rates and lower incomes due to systemic racism and colonial legacies.
Women: Persisting gender pay gap and "ceiling effect" limit income even at top levels.
Persons with Disabilities: Higher poverty rates, especially for those with severe disabilities.
Children in Single-Parent Families: Particularly at risk of poverty.
Seniors: Poverty rates have fluctuated, with recent increases among those without home ownership.
Geography: Rural incomes are lower than urban; provincial differences are significant.
Summary
Inequality in Canada has grown steadily over the past 40 years.
Taxes and transfers reduce, but do not eliminate, inequality.
Disadvantage is concentrated among marginalized groups, intersecting with systemic racism, sexism, ableism, and colonialism.
