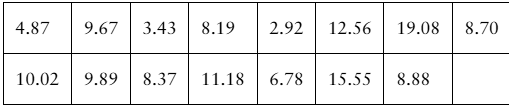
Constructing Confidence Intervals In Exercises 13–24, assume the sample is from a normally distributed population and construct the indicated confidence intervals for (b) the population standard deviation σ. Interpret the results. Drug Concentration The times (in minutes) for the drug concentration to peak when the drug epinephrine is injected into 15 randomly selected patients are listed. Use a 90% level of confidence.
Verified step by step guidance
1
Step 1: Calculate the sample variance (s²) using the formula s² = Σ(xᵢ - x̄)² / (n - 1), where xᵢ represents each data point, x̄ is the sample mean, and n is the sample size. First, compute the sample mean (x̄) by summing all the data points and dividing by the sample size (n = 15).
Step 2: Use the sample variance (s²) to calculate the sample standard deviation (s), which is the square root of the sample variance: s = √s².
Step 3: Identify the degrees of freedom (df), which is equal to n - 1. For this problem, df = 15 - 1 = 14.
Step 4: Use the chi-square distribution to find the critical values for the 90% confidence interval. The critical values are determined using the chi-square table or statistical software for the given degrees of freedom (df = 14) and the confidence level (90%). The lower critical value (χ²₁) corresponds to 5% in the lower tail, and the upper critical value (χ²₂) corresponds to 5% in the upper tail.
Step 5: Construct the confidence interval for the population standard deviation (σ) using the formula: CI = [√((n - 1)s² / χ²₂), √((n - 1)s² / χ²₁)], where χ²₁ and χ²₂ are the critical values from the chi-square distribution. Interpret the results by explaining the range within which the true population standard deviation is likely to fall with 90% confidence.
Verified video answer for a similar problem:
This video solution was recommended by our tutors as helpful for the problem above
Video duration:
4m
Play a video:
0 Comments
Key Concepts
Here are the essential concepts you must grasp in order to answer the question correctly.
Confidence Interval
A confidence interval is a range of values, derived from sample statistics, that is likely to contain the true population parameter with a specified level of confidence. For example, a 90% confidence interval suggests that if we were to take many samples and construct intervals in the same way, approximately 90% of those intervals would contain the true population parameter.
The population standard deviation (σ) is a measure of the dispersion or spread of a set of values in a population. It quantifies how much the individual data points deviate from the population mean. In constructing confidence intervals for σ, we often use sample data to estimate this parameter, which is crucial for understanding variability in the population.
Normal distribution is a probability distribution that is symmetric about the mean, showing that data near the mean are more frequent in occurrence than data far from the mean. Many statistical methods, including confidence interval construction, assume that the underlying population is normally distributed, which allows for the application of specific formulas and techniques to estimate parameters like the population standard deviation.

 Verified step by step guidance
 06:33
06:33
