Performing a One-Way ANOVA Test In Exercises 5–14, (a) identify the claim and state H0 and Ha, (b) find the critical value and identify the rejection region, (c) find the test statistic F, (d) decide whether to reject or fail to reject the null hypothesis, and (e) interpret the decision in the context of the original claim. Assume the samples are random and independent, the populations are normally distributed, and the population variances are equal.
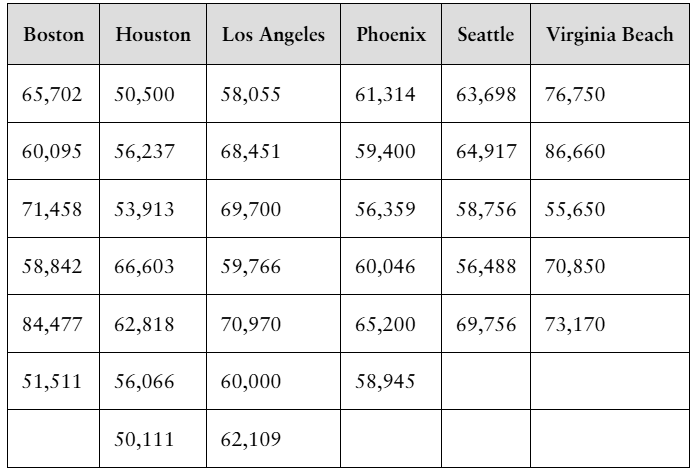
[APPLET] Statistician Salaries The table shows the salaries of a sample of entry level statisticians from six large metropolitan areas. At α=0.05, can you conclude that the mean salary is different in at least one of the areas? (Adapted from Salary.com)
Verified step by step guidance
1
Step 1: Identify the claim and state the hypotheses. The claim is that the mean salary is different in at least one of the metropolitan areas. Formally, the null hypothesis (H0) is that all group means are equal: . The alternative hypothesis (Ha) is that at least one mean is different: .
Step 2: Find the critical value and identify the rejection region. Since this is a one-way ANOVA test at significance level , determine the degrees of freedom: between groups where (number of groups), and within groups where is the total number of observations across all groups. Use an F-distribution table or software to find the critical value . The rejection region is .
Step 3: Calculate the test statistic F. First, compute the group means and the overall mean. Then calculate the Sum of Squares Between (SSB) and Sum of Squares Within (SSW). Use these to find the Mean Square Between (MSB = SSB/df_1) and Mean Square Within (MSW = SSW/df_2). The test statistic is .
Step 4: Make a decision by comparing the test statistic to the critical value. If , reject the null hypothesis; otherwise, fail to reject it.
Step 5: Interpret the decision in context. If you rejected H0, conclude that there is sufficient evidence at the 0.05 significance level to say that the mean salary differs in at least one metropolitan area. If you failed to reject H0, conclude that there is not sufficient evidence to say the mean salaries differ.
Verified video answer for a similar problem:
This video solution was recommended by our tutors as helpful for the problem above
Video duration:
8m
Play a video:
0 Comments
Key Concepts
Here are the essential concepts you must grasp in order to answer the question correctly.
One-Way ANOVA Test
One-Way ANOVA (Analysis of Variance) is a statistical method used to compare the means of three or more independent groups to determine if at least one group mean is significantly different. It tests the null hypothesis that all group means are equal against the alternative that at least one differs. This method assumes normality, independence, and equal variances across groups.
Hypothesis testing involves stating a null hypothesis (H0) and an alternative hypothesis (Ha), then using sample data to decide whether to reject H0. The rejection region is determined by the critical value from the F-distribution at a chosen significance level (α), here 0.05. If the test statistic falls in this region, H0 is rejected, indicating significant differences among group means.
The F-statistic in ANOVA is the ratio of variance between group means to variance within groups. A larger F-value suggests greater differences among group means relative to variability within groups. Calculating this statistic helps determine if observed differences are statistically significant, guiding the decision to reject or fail to reject the null hypothesis.

 Verified step by step guidance
 05:31
05:31
