"Using Technology to Perform a Two-Way ANOVA Test In Exercises 15–18, use technology and the block design to perform a two-way ANOVA test. Use α=0.10. Interpret the results. Assume the samples are random and independent, the populations are normally distributed, and the population variances are equal.
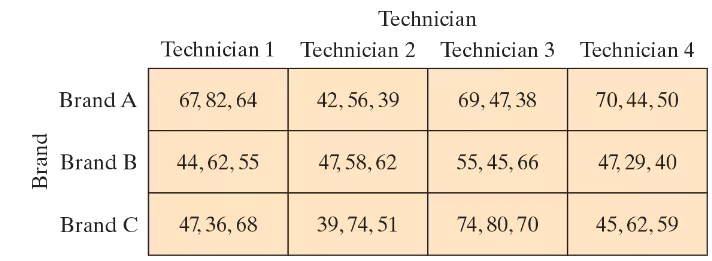
[APPLET] Laptop Repairs The manager of a computer repair service wants to determine whether there is a difference in the time it takes four technicians to repair different brands of laptops. The block design shows the times (in minutes) it took for each technician to repair three laptops of each brand.
Verified step by step guidance
1
Step 1: Organize the data into a two-way ANOVA format. The rows represent the laptop brands (Brand A, Brand B, Brand C), and the columns represent the technicians (Technician 1, Technician 2, Technician 3, Technician 4). Each cell contains the repair times for the respective brand and technician.
Step 2: Calculate the mean repair time for each brand (row means) and each technician (column means). This helps to understand the overall trends in the data.
Step 3: Use technology (e.g., statistical software or a calculator) to compute the sum of squares for the factors (brands and technicians), the interaction between the factors, and the error term. These values are necessary for the ANOVA table.
Step 4: Construct the ANOVA table, including the degrees of freedom, sum of squares, mean squares, F-statistic, and p-value for each factor (brands and technicians) and their interaction. Use α=0.10 as the significance level.
Step 5: Interpret the results. Compare the p-values for the factors and their interaction to α=0.10. If the p-value is less than α, conclude that there is a significant difference for that factor or interaction. Otherwise, conclude that there is no significant difference.
Verified video answer for a similar problem:
This video solution was recommended by our tutors as helpful for the problem above
Video duration:
2m
Play a video:
0 Comments
Key Concepts
Here are the essential concepts you must grasp in order to answer the question correctly.
Two-Way ANOVA
Two-Way ANOVA (Analysis of Variance) is a statistical method used to determine the effect of two independent categorical variables on a continuous dependent variable. It helps in assessing whether there are any statistically significant differences between the means of different groups. In this case, the two factors are the technicians and the brands of laptops, and the dependent variable is the time taken for repairs.
Block design is an experimental design technique that involves grouping similar experimental units into blocks to reduce variability. In this scenario, each technician represents a block, and the aim is to control for the variability in repair times that may arise from differences among technicians. This design allows for a clearer analysis of the effect of the brands on repair times while accounting for technician differences.
ANOVA relies on several key assumptions: the samples must be independent, the populations should be normally distributed, and the population variances should be equal (homogeneity of variance). In this exercise, these assumptions are crucial for the validity of the test results. If these assumptions are violated, the results of the ANOVA may not be reliable, leading to incorrect conclusions about the differences in repair times.

 Verified step by step guidance
 05:31
05:31