A stemplot contains the row 2|0024555789. List the data points displayed in this row.
Table of contents
- 1. Intro to Stats and Collecting Data1h 14m
- 2. Describing Data with Tables and Graphs1h 56m
- 3. Describing Data Numerically2h 5m
- 4. Probability2h 17m
- 5. Binomial Distribution & Discrete Random Variables3h 6m
- 6. Normal Distribution and Continuous Random Variables2h 11m
- 7. Sampling Distributions & Confidence Intervals: Mean3h 23m
- Sampling Distribution of the Sample Mean and Central Limit Theorem19m
- Distribution of Sample Mean - ExcelBonus23m
- Introduction to Confidence Intervals15m
- Confidence Intervals for Population Mean1h 18m
- Determining the Minimum Sample Size Required12m
- Finding Probabilities and T Critical Values - ExcelBonus28m
- Confidence Intervals for Population Means - ExcelBonus25m
- 8. Sampling Distributions & Confidence Intervals: Proportion2h 10m
- 9. Hypothesis Testing for One Sample5h 8m
- Steps in Hypothesis Testing1h 6m
- Performing Hypothesis Tests: Means1h 4m
- Hypothesis Testing: Means - ExcelBonus42m
- Performing Hypothesis Tests: Proportions37m
- Hypothesis Testing: Proportions - ExcelBonus27m
- Performing Hypothesis Tests: Variance12m
- Critical Values and Rejection Regions28m
- Link Between Confidence Intervals and Hypothesis Testing12m
- Type I & Type II Errors16m
- 10. Hypothesis Testing for Two Samples5h 37m
- Two Proportions1h 13m
- Two Proportions Hypothesis Test - ExcelBonus28m
- Two Means - Unknown, Unequal Variance1h 3m
- Two Means - Unknown Variances Hypothesis Test - ExcelBonus12m
- Two Means - Unknown, Equal Variance15m
- Two Means - Unknown, Equal Variances Hypothesis Test - ExcelBonus9m
- Two Means - Known Variance12m
- Two Means - Sigma Known Hypothesis Test - ExcelBonus21m
- Two Means - Matched Pairs (Dependent Samples)42m
- Matched Pairs Hypothesis Test - ExcelBonus12m
- Two Variances and F Distribution29m
- Two Variances - Graphing CalculatorBonus16m
- 11. Correlation1h 24m
- 12. Regression3h 33m
- Linear Regression & Least Squares Method26m
- Residuals12m
- Coefficient of Determination12m
- Regression Line Equation and Coefficient of Determination - ExcelBonus8m
- Finding Residuals and Creating Residual Plots - ExcelBonus11m
- Inferences for Slope31m
- Enabling Data Analysis ToolpakBonus1m
- Regression Readout of the Data Analysis Toolpak - ExcelBonus21m
- Prediction Intervals13m
- Prediction Intervals - ExcelBonus19m
- Multiple Regression - ExcelBonus29m
- Quadratic Regression15m
- Quadratic Regression - ExcelBonus10m
- 13. Chi-Square Tests & Goodness of Fit2h 21m
- 14. ANOVA2h 29m
2. Describing Data with Tables and Graphs
Stemplots (Stem-and-Leaf Plots)
Problem 2.T.6
Textbook Question
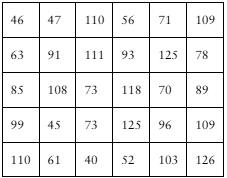
The following data represent the time (in minutes) students spent working their Section 1.1 homework from Sullivan’s College Algebra course (based on time logged into MyLabMath). Draw a stem-and-leaf diagram of the data and comment on the shape of the distribution.

Verified step by step guidance1
Step 1: Organize the data by separating each value into a 'stem' and a 'leaf'. The 'stem' consists of all but the last digit, and the 'leaf' is the last digit. For example, for 46, the stem is 4 and the leaf is 6; for 110, the stem is 11 and the leaf is 0.
Step 2: List the stems in ascending order vertically. For each stem, write the corresponding leaves in ascending order horizontally next to it. This forms the stem-and-leaf plot, which visually represents the distribution of the data.
Step 3: After constructing the stem-and-leaf plot, examine the shape of the distribution by observing the spread and concentration of leaves across the stems. Look for patterns such as symmetry, skewness, gaps, or clusters.
Step 4: Identify the center of the distribution by noting where most leaves are concentrated. Also, observe if the distribution is skewed to the left (longer tail on the lower values) or to the right (longer tail on the higher values), or if it appears roughly symmetric.
Step 5: Summarize your observations about the shape of the distribution based on the stem-and-leaf plot, commenting on whether it is symmetric, skewed, has outliers, or any other notable features.
Verified video answer for a similar problem:This video solution was recommended by our tutors as helpful for the problem above
Video duration:
2mPlay a video:
0 Comments
Key Concepts
Here are the essential concepts you must grasp in order to answer the question correctly.
Stem-and-Leaf Diagram
A stem-and-leaf diagram is a method of displaying quantitative data that organizes numbers by place value. The 'stem' represents the leading digit(s), while the 'leaf' shows the last digit. This format helps visualize the distribution and retains the original data values, making it easier to identify patterns and outliers.
Recommended video:
Creating Stemplots
Distribution Shape
The shape of a distribution describes how data values are spread and clustered, such as symmetric, skewed, or uniform. Analyzing the shape helps understand the data’s central tendency, variability, and presence of outliers. For example, a right-skewed distribution has a longer tail on the right side, indicating some larger values.
Recommended video:
Uniform Distribution
Data Organization and Interpretation
Organizing raw data into a visual format like a stem-and-leaf plot aids in interpreting key features such as central values, spread, and gaps. Proper interpretation involves summarizing these features to draw conclusions about the dataset, which is essential for making informed decisions or further statistical analysis.
Recommended video:
Introduction to Collecting Data
Related Videos
Related Practice
Multiple Choice
413
views
10
rank
