Graph each function over the interval [-2π, 2π]. Give the amplitude. See Example 1. y = -2 sin x
Verified step by step guidance
1
Identify the function type: The given function is a sine function, specifically \( y = -2 \sin x \).
Determine the amplitude: The amplitude of a sine function \( y = a \sin x \) is the absolute value of \( a \). Here, \( a = -2 \), so the amplitude is \( | -2 | = 2 \).
Understand the effect of the negative sign: The negative sign in front of the amplitude indicates a reflection over the x-axis. This means the graph of \( y = -2 \sin x \) will be an upside-down version of \( y = 2 \sin x \).
Set the interval for graphing: The problem specifies the interval \([-2\pi, 2\pi]\). This means you will graph the function from \(-2\pi\) to \(2\pi\) on the x-axis.
Sketch the graph: Start by plotting key points of the sine function within the interval, considering the amplitude and reflection. The key points for \( y = \sin x \) are at \( x = 0, \pi/2, \pi, 3\pi/2, 2\pi \) and their corresponding negative values. Reflect these points over the x-axis and scale by the amplitude of 2.
Verified video answer for a similar problem:
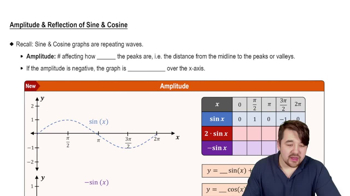
This video solution was recommended by our tutors as helpful for the problem above
Play a video:
Was this helpful?
Key Concepts
Here are the essential concepts you must grasp in order to answer the question correctly.
Amplitude
Amplitude refers to the maximum distance a wave reaches from its central axis. In the context of sine functions, it is the coefficient in front of the sine term. For the function y = -2 sin x, the amplitude is 2, indicating that the graph oscillates 2 units above and below the horizontal axis.
Graphing trigonometric functions involves plotting the values of the function over a specified interval. For sine functions, the graph typically oscillates between its maximum and minimum values, determined by the amplitude. Understanding the periodic nature of sine functions is crucial, as they repeat every 2π radians.
A negative sine function, such as y = -2 sin x, reflects the standard sine wave across the horizontal axis. This means that the peaks of the sine wave become troughs and vice versa. The negative sign affects the orientation of the graph but does not change the amplitude, which remains 2 in this case.