Here are the essential concepts you must grasp in order to answer the question correctly.
Graphing Polynomial Functions
Graphing polynomial functions involves plotting points based on the function's equation. The shape of the graph is determined by the degree and leading coefficient of the polynomial. For example, a cubic function like h(x) = -(x + 1)³ will have an 'S' shape, reflecting its turning points and end behavior.
Recommended video:
Graph of Sine and Cosine Function
Transformation of Functions
Transformation of functions refers to the changes made to the basic graph of a function through shifts, stretches, or reflections. In the case of h(x) = -(x + 1)³, the graph is shifted left by 1 unit due to the (x + 1) term and reflected across the x-axis because of the negative sign, altering its orientation.
Recommended video:
Domain and Range of Function Transformations
Identifying Key Features of the Graph
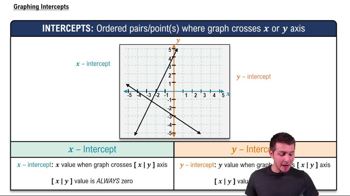
Identifying key features of a graph includes determining the intercepts, turning points, and end behavior. For h(x) = -(x + 1)³, the y-intercept can be found by evaluating h(0), and the turning point occurs at the vertex of the cubic function. Understanding these features helps in accurately sketching the graph.
Recommended video: