Graph each function. See Examples 1 and 2. ƒ(x) = -½ x²
Verified step by step guidance
1
Identify the type of function given. Here, ƒ(x) = -\(\frac{1}{2}\) x^{2} is a quadratic function, which graphs as a parabola.
Note the coefficient of x², which is -\(\frac{1}{2}\). Since it is negative, the parabola opens downward, and the factor \(\frac{1}{2}\) affects the width, making it wider than the standard parabola y = -x².
Determine the vertex of the parabola. For the function ƒ(x) = a x^{2} + bx + c, the vertex is at x = -\(\frac{b}{2a}\). Here, b = 0, so the vertex is at x = 0. Calculate ƒ(0) to find the vertex point.
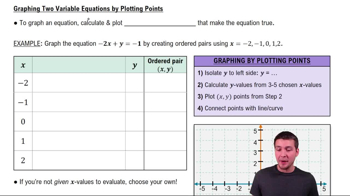
Create a table of values by choosing x-values around the vertex (for example, x = -2, -1, 0, 1, 2), then compute the corresponding y-values using the function ƒ(x) = -\(\frac{1}{2}\) x^{2}.
Plot the points from the table on the coordinate plane and draw a smooth curve through them to complete the graph of the parabola.
Verified video answer for a similar problem:
This video solution was recommended by our tutors as helpful for the problem above
Video duration:
6m
Play a video:
0 Comments
Key Concepts
Here are the essential concepts you must grasp in order to answer the question correctly.
Quadratic Functions and Their Graphs
A quadratic function is a polynomial of degree two, typically written as f(x) = ax² + bx + c. Its graph is a parabola that opens upwards if a > 0 and downwards if a < 0. Understanding the shape and orientation of the parabola is essential for graphing.
The leading coefficient (a) affects the width and direction of the parabola. A negative coefficient, like -½, flips the parabola downward, while its absolute value controls how 'wide' or 'narrow' the curve appears. Smaller absolute values make the parabola wider.
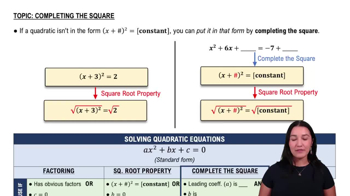
Solving Quadratic Equations by Completing the Square
Plotting Key Points and Vertex
To graph a quadratic function, identify the vertex (the highest or lowest point) and plot additional points by substituting x-values. For f(x) = -½ x², the vertex is at the origin (0,0), and points on either side help define the parabola's shape.

 Verified step by step guidance
 6:36
6:36