Textbook Question
Concept Check Graph the points on a coordinate system and identify the quadrant or axis for each point. (3, 2)
614
views
 Verified step by step guidance
 6:36
6:36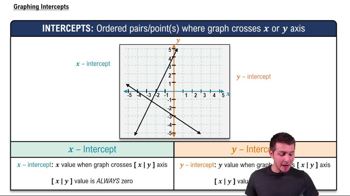 4:08 4:08
Concept Check Graph the points on a coordinate system and identify the quadrant or axis for each point. (3, 2)
Find the domain of each rational expression. See Example 1. (x³ - 1) / (x - 1)
Find each square root. See Example 1. √4⁄25
Solve each linear equation. See Examples 1–3. 6(3x - 1) = 8 - (10x - 14)
Find each square root. See Example 1. -√144⁄121
Find each sum or difference. See Example 1. 4 - 9