Skip to main content
Statistics for Business
My Course
Learn
Exam Prep
AI Tutor
Study Guides
Flashcards
Explore
Try the app
My Course
Learn
Exam Prep
AI Tutor
Study Guides
Flashcards
Explore
Try the app
Back
Goodness of Fit Test - Excel definitions
You can tap to flip the card.
Goodness of Fit Test
You can tap to flip the card.
👆
Goodness of Fit Test
A statistical procedure for comparing observed frequencies to those expected under a claimed distribution.
Track progress
Control buttons has been changed to "navigation" mode.
1/15
Related flashcards
Related practice
Recommended videos
Goodness of Fit Test - Excel quiz
Goodness of Fit Test - Excel
15 Terms
Contingency Tables
13. Chi-Square Tests & Goodness of Fit
8 problems
Topic
Zachary
13. Chi-Square Tests & Goodness of Fit
3 topics
15 problems
Chapter
Brendan
Guided course
04:24
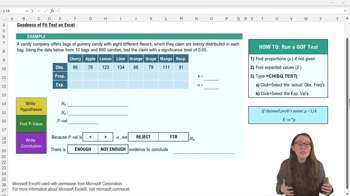
Goodness of FIt Test - Excel Example 1
50
views
Guided course
05:54
Goodness of FIt Test - Excel
71
views
Terms in this set (15)
Hide definitions
Goodness of Fit Test
A statistical procedure for comparing observed frequencies to those expected under a claimed distribution.
Chi-Square Statistic
A value measuring the discrepancy between observed and expected frequencies across categories.
Observed Frequency
The actual count of occurrences recorded for each category in a dataset.
Expected Value
A calculated count for each category, found by multiplying sample size by category proportion.
Category Proportion
A probability assigned to each group, often found by dividing one by the number of categories.
Null Hypothesis
A statement asserting that observed data matches the claimed or expected distribution.
Alternative Hypothesis
A statement suggesting that observed data does not match the claimed or expected distribution.
Significance Level
A threshold, often denoted alpha, used to determine whether to reject the null hypothesis.
P-Value
A probability indicating how likely observed results are under the null hypothesis.
CHISQ.TEST Function
An Excel tool that computes the p-value for a chi-square test using observed and expected values.
Sample Size
The total number of observations or items included in the analysis.
Category
A distinct group or type within the data, such as a specific flavor in a candy bag.
Alpha
A chosen cutoff probability, commonly 0.05, for deciding statistical significance.
Claimed Distribution
An assumed pattern or spread of data across categories, used as a basis for comparison.
Frequency Table
A structured display showing counts for each category, often used to organize observed data.
 BackBack

 04:24
04:24