Skip to main content
Statistics for Business
My Course
Learn
Exam Prep
AI Tutor
Study Guides
Flashcards
Explore
Try the app
My Course
Learn
Exam Prep
AI Tutor
Study Guides
Flashcards
Explore
Try the app
Back
Goodness of Fit Test - Excel quiz
You can tap to flip the card.
What is the null hypothesis in a chi-square goodness of fit test?
You can tap to flip the card.
👆
What is the null hypothesis in a chi-square goodness of fit test?
The null hypothesis states that the observed frequencies match the claimed distribution.
Track progress
Control buttons has been changed to "navigation" mode.
1/15
Related flashcards
Related practice
Recommended videos
Goodness of Fit Test - Excel definitions
Goodness of Fit Test - Excel
15 Terms
Contingency Tables
13. Chi-Square Tests & Goodness of Fit
8 problems
Topic
Zachary
13. Chi-Square Tests & Goodness of Fit
3 topics
15 problems
Chapter
Brendan
Guided course
04:24
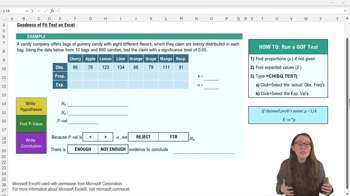
Goodness of FIt Test - Excel Example 1
50
views
Guided course
05:54
Goodness of FIt Test - Excel
71
views
Terms in this set (15)
Hide definitions
What is the null hypothesis in a chi-square goodness of fit test?
The null hypothesis states that the observed frequencies match the claimed distribution.
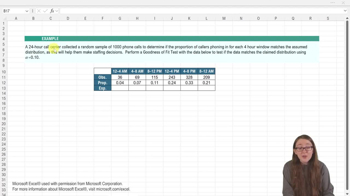
How do you calculate the expected value for each category in a goodness of fit test?
Multiply the total sample size (n) by the category proportion (p) for each category.
What Excel function is used to calculate the p-value for a chi-square goodness of fit test?
The CHISQ.TEST function is used to calculate the p-value.
How do you find the category proportion if the distribution is even and there are k categories?
Divide 1 by the number of categories (k) to get the proportion for each category.
What do you compare the p-value to in order to make a decision in hypothesis testing?
Compare the p-value to the significance level (alpha) to decide whether to reject the null hypothesis.
What is the alternative hypothesis in a chi-square goodness of fit test?
The alternative hypothesis states that the observed frequencies do not match the claimed distribution.
If the p-value is less than alpha, what is the conclusion of the test?
You reject the null hypothesis, concluding there is enough evidence that the observed frequencies do not match the claimed distribution.
How can you quickly find the total sample size (n) in Excel if it is not given?
Use the SUM function to add up all the observed frequencies.
What are the two required inputs for the CHISQ.TEST function in Excel?
The observed frequencies (actual range) and the expected frequencies (expected range).
Why is it useful to use Excel for a goodness of fit test?
Excel automates calculations for expected values and p-values, making the process faster and less error-prone.
What does a very small p-value (e.g., 0.00008) indicate in a goodness of fit test?
It indicates strong evidence against the null hypothesis, suggesting the observed distribution does not match the claimed distribution.
How do you copy a formula across multiple cells in Excel?
Click and drag the solid black cross at the bottom right corner of the cell to copy the formula across.
What is the significance level (alpha) commonly used in hypothesis testing?
A common significance level is 0.05.
What does the expected value represent in a goodness of fit test?
It represents the frequency you would expect in each category if the null hypothesis were true.
What is the first step in performing a chi-square goodness of fit test in Excel?
The first step is to write the null and alternative hypotheses.
 BackBack

 04:24
04:24