
Textbook Question
Identifying Extrema
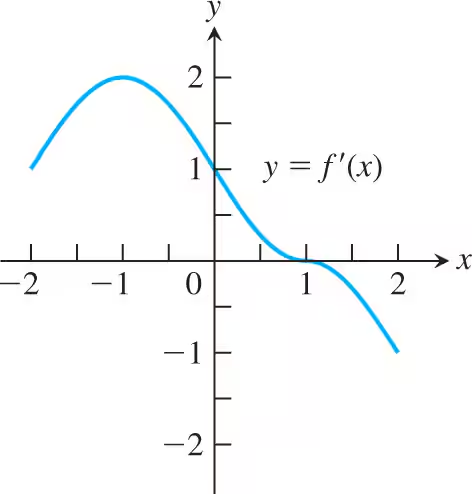
In Exercises 61 and 62, the graph of f' is given. Assume that f is continuous, and determine the x-values corresponding to local minima and local maxima.
177
views
 Verified step by step guidanceVerified video answer for a similar problem:
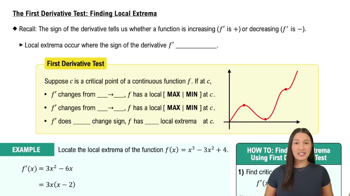
 07:09
07:09 04:50
04:50 06:15
06:15