Textbook Question
Absolute maxima and minima Determine the location and value of the absolute extreme values of ƒ on the given interval, if they exist.
ƒ(x) = (2x)ˣ on [0.1,1]
336
views

 Verified step by step guidance
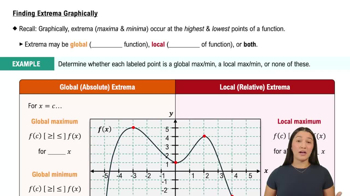
 05:58
05:58 04:50
04:50 6:22
6:22Absolute maxima and minima Determine the location and value of the absolute extreme values of ƒ on the given interval, if they exist.
ƒ(x) = (2x)ˣ on [0.1,1]
Absolute maxima and minima Determine the location and value of the absolute extreme values of ƒ on the given interval, if they exist.
ƒ(x) = x³e⁻ˣ on [-1,5]
{Use of Tech} Special curves The following classical curves have been studied by generations of mathematicians. Use analytical methods (including implicit differentiation) and a graphing utility to graph the curves. Include as much detail as possible.
x²/₃ + y²/₃ = 1 (Astroid or hypocycloid with four cusps)
Use the following graphs to identify the points on the interval [a, b] at which local and absolute extreme values occur. <IMAGE>
Finding antiderivatives. Find all the antiderivatives of the following functions. Check your work by taking derivatives.
ƒ(x) = 2 sinx + 1
{Use of Tech} Tumor size In a study conducted at Dartmouth College, mice with a particular type of cancerous tumor were treated with the chemotherapy drug Cisplatin. If the volume of one of these tumors at the time of treatment is V₀, then the volume of the tumor t days after treatment is modeled by the function V(t) = V₀ (0.99e⁻⁰·¹²¹⁶ᵗ + 0.01e⁰·²³⁹ᵗ). (Source: Undergraduate Mathematics for the Life Sciences, MAA Notes No. 81, 2013)
Plot a graph of y = 0.99e⁻⁰·¹²¹⁶ᵗ + 0.01e⁰·²³⁹ᵗ, for 0 ≤ t ≤ 16, and describe the tumor size over time. Use Newton’s method to determine when the tumor decreases to half of its original size.