Textbook Question
The diagram shows the energy of a reaction as the reaction progresses. Label each blank box in the diagram.
a. reactants b. products c. activation energy (Ea) d. enthalpy of reaction (ΔHrxn)
2043
views
 Verified step by step guidance
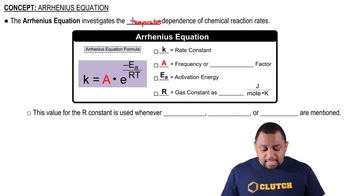
 01:20
01:20 02:02
02:02 00:34
00:34The diagram shows the energy of a reaction as the reaction progresses. Label each blank box in the diagram.
a. reactants b. products c. activation energy (Ea) d. enthalpy of reaction (ΔHrxn)
The half-life for the radioactive decay of C-14 is 5715 years and is independent of the initial concentration. If a sample of C-14 initially contains 1.5 mmol of C-14, how many millimoles are left after 2725 years?
The data shown here were collected for the first-order reaction: N2O(g) → N2(g) + O(g) Use an Arrhenius plot to determine the activation barrier and frequency factor for the reaction.
Temperature (K) Rate Constant (1 , s)
800 3.24⨉10- 5
900 0.00214
1000 0.0614
1100 0.955
The tabulated data show the rate constant of a reaction measured at several different temperatures. Use an Arrhenius plot to determine the activation barrier and frequency factor for the reaction.
Temperature (K) Rate Constant (1 , s)
300 0.0134
310 0.0407
320 0.114
330 0.303
340 0.757
The activation energy of a reaction is 44.2 kJ/mol and the frequency factor is 1.9⨉1011/ s. Calculate the rate constant of the reaction at 25 °C.