True or False: The shape of the distribution shown is best classified as skewed left.
Table of contents
- 1. Intro to Stats and Collecting Data1h 14m
- 2. Describing Data with Tables and Graphs1h 56m
- 3. Describing Data Numerically2h 5m
- 4. Probability2h 17m
- 5. Binomial Distribution & Discrete Random Variables3h 6m
- 6. Normal Distribution and Continuous Random Variables2h 11m
- 7. Sampling Distributions & Confidence Intervals: Mean3h 23m
- Sampling Distribution of the Sample Mean and Central Limit Theorem19m
- Distribution of Sample Mean - ExcelBonus23m
- Introduction to Confidence Intervals15m
- Confidence Intervals for Population Mean1h 18m
- Determining the Minimum Sample Size Required12m
- Finding Probabilities and T Critical Values - ExcelBonus28m
- Confidence Intervals for Population Means - ExcelBonus25m
- 8. Sampling Distributions & Confidence Intervals: Proportion2h 10m
- 9. Hypothesis Testing for One Sample5h 8m
- Steps in Hypothesis Testing1h 6m
- Performing Hypothesis Tests: Means1h 4m
- Hypothesis Testing: Means - ExcelBonus42m
- Performing Hypothesis Tests: Proportions37m
- Hypothesis Testing: Proportions - ExcelBonus27m
- Performing Hypothesis Tests: Variance12m
- Critical Values and Rejection Regions28m
- Link Between Confidence Intervals and Hypothesis Testing12m
- Type I & Type II Errors16m
- 10. Hypothesis Testing for Two Samples5h 37m
- Two Proportions1h 13m
- Two Proportions Hypothesis Test - ExcelBonus28m
- Two Means - Unknown, Unequal Variance1h 3m
- Two Means - Unknown Variances Hypothesis Test - ExcelBonus12m
- Two Means - Unknown, Equal Variance15m
- Two Means - Unknown, Equal Variances Hypothesis Test - ExcelBonus9m
- Two Means - Known Variance12m
- Two Means - Sigma Known Hypothesis Test - ExcelBonus21m
- Two Means - Matched Pairs (Dependent Samples)42m
- Matched Pairs Hypothesis Test - ExcelBonus12m
- Two Variances and F Distribution29m
- Two Variances - Graphing CalculatorBonus16m
- 11. Correlation1h 24m
- 12. Regression3h 33m
- Linear Regression & Least Squares Method26m
- Residuals12m
- Coefficient of Determination12m
- Regression Line Equation and Coefficient of Determination - ExcelBonus8m
- Finding Residuals and Creating Residual Plots - ExcelBonus11m
- Inferences for Slope31m
- Enabling Data Analysis ToolpakBonus1m
- Regression Readout of the Data Analysis Toolpak - ExcelBonus21m
- Prediction Intervals13m
- Prediction Intervals - ExcelBonus19m
- Multiple Regression - ExcelBonus29m
- Quadratic Regression15m
- Quadratic Regression - ExcelBonus10m
- 13. Chi-Square Tests & Goodness of Fit2h 21m
- 14. ANOVA2h 29m
2. Describing Data with Tables and Graphs
Histograms
Problem 2.2.8
Textbook Question
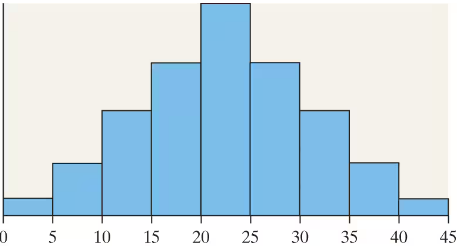
True or False: The shape of the distribution shown is best classified as uniform.

Verified step by step guidance1
Step 1: Understand the definition of a uniform distribution. A uniform distribution has bars (or frequencies) that are approximately the same height across all intervals, indicating equal frequency or probability for each value range.
Step 2: Observe the histogram provided. Notice that the bars are not all the same height; instead, they rise to a peak in the center and then symmetrically decrease on both sides.
Step 3: Recognize that this shape is characteristic of a symmetric distribution with a single peak, often called a bell-shaped or normal-like distribution, rather than a uniform distribution.
Step 4: Conclude that since the bars are not equal in height and the distribution has a clear center peak, the shape is not uniform.
Step 5: Therefore, the statement 'The shape of the distribution shown is best classified as uniform' is false.
Verified video answer for a similar problem:This video solution was recommended by our tutors as helpful for the problem above
Video duration:
1mPlay a video:
0 Comments
Key Concepts
Here are the essential concepts you must grasp in order to answer the question correctly.
Uniform Distribution
A uniform distribution is one where all outcomes or values have approximately the same frequency or probability. In a histogram, this appears as bars of roughly equal height across the range, indicating no particular value is more common than others.
Recommended video:
Uniform Distribution
Shape of a Distribution
The shape of a distribution describes the overall pattern of data values, such as symmetric, skewed, or uniform. Recognizing the shape helps in understanding the data's behavior and selecting appropriate statistical methods.
Recommended video:
Uniform Distribution
Symmetric Distribution
A symmetric distribution has a balanced shape where the left and right sides mirror each other around a central peak. This often indicates that data values cluster around a central point, unlike a uniform distribution where frequencies are equal.
Recommended video:
Uniform Distribution
Related Videos
Related Practice
Textbook Question
49
views
