In Exercises 13–16, (a) find the margin of error for the values of c, s, and n, and (b) construct the confidence interval for using the t-distribution. Assume the population is normally distributed. c = 0.98, s = 0.9, n = 12, xbar = 6.8
Verified step by step guidance
1
Step 1: Identify the formula for the margin of error (E) when using the t-distribution. The formula is E = t * (s / sqrt(n)), where t is the critical value from the t-distribution table, s is the sample standard deviation, and n is the sample size.
Step 2: Determine the degrees of freedom (df) for the t-distribution. The formula for degrees of freedom is df = n - 1. In this case, n = 12, so df = 12 - 1 = 11.
Step 3: Look up the critical value (t) for a confidence level of c = 0.98 and df = 11 in the t-distribution table. This value corresponds to the two-tailed critical value for a 98% confidence level.
Step 4: Substitute the values of t, s, and n into the margin of error formula E = t * (s / sqrt(n)). Use the given values: s = 0.9 and n = 12. Simplify the expression to calculate E.
Step 5: Construct the confidence interval using the formula: Confidence Interval = x̄ ± E, where x̄ is the sample mean. Substitute x̄ = 6.8 and the calculated margin of error (E) to find the lower and upper bounds of the confidence interval.
Verified video answer for a similar problem:
This video solution was recommended by our tutors as helpful for the problem above
Video duration:
4m
Play a video:
Was this helpful?
Key Concepts
Here are the essential concepts you must grasp in order to answer the question correctly.
Margin of Error
The margin of error quantifies the uncertainty in a sample estimate. It is calculated using the critical value from the t-distribution, the sample standard deviation, and the square root of the sample size. A larger margin of error indicates less precision in the estimate, while a smaller margin suggests greater reliability.
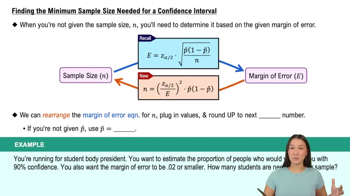
Finding the Minimum Sample Size Needed for a Confidence Interval
Confidence Interval
A confidence interval provides a range of values within which we expect the true population parameter to lie, with a specified level of confidence. It is constructed by adding and subtracting the margin of error from the sample mean. For a confidence level of 0.98, we use the t-distribution to find the appropriate critical value based on the sample size.
The t-distribution is a probability distribution used when estimating population parameters when the sample size is small and the population standard deviation is unknown. It is similar to the normal distribution but has heavier tails, which accounts for the increased variability in smaller samples. As the sample size increases, the t-distribution approaches the normal distribution.