Finding the Margin of Error In Exercises 33 and 34, use the confidence interval to find the estimated margin of error. Then find the sample mean. Book Prices A store manager reports a confidence interval of (244.07, 280.97) when estimating the mean price (in dollars) for the population of textbooks.
Verified step by step guidance
1
Step 1: Understand the concept of margin of error. The margin of error (E) is half the width of the confidence interval. It represents the maximum expected difference between the true population parameter and the sample estimate within the given confidence level.
Step 2: Calculate the width of the confidence interval by subtracting the lower bound from the upper bound. Use the formula: . In this case, the upper bound is 280.97 and the lower bound is 244.07.
Step 3: Divide the width of the confidence interval by 2 to find the margin of error. Use the formula: .
Step 4: Calculate the sample mean by finding the midpoint of the confidence interval. Use the formula: . This gives the central value of the confidence interval.
Step 5: Summarize the results. The margin of error (E) and the sample mean are the two key values derived from the confidence interval. Ensure all calculations are accurate and clearly interpreted.
Verified video answer for a similar problem:
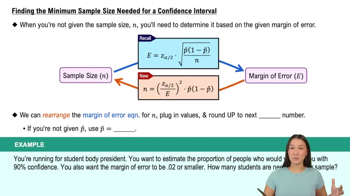
This video solution was recommended by our tutors as helpful for the problem above
Video duration:
1m
Play a video:
Was this helpful?
Key Concepts
Here are the essential concepts you must grasp in order to answer the question correctly.
Margin of Error
The margin of error quantifies the uncertainty associated with a sample estimate. It represents the range within which the true population parameter is expected to lie, given a certain confidence level. In the context of a confidence interval, it is calculated as half the width of the interval, indicating how much the sample mean may differ from the actual population mean.
Finding the Minimum Sample Size Needed for a Confidence Interval
Confidence Interval
A confidence interval is a range of values, derived from a sample statistic, that is likely to contain the true population parameter with a specified level of confidence. For example, a 95% confidence interval suggests that if we were to take many samples, approximately 95% of the calculated intervals would contain the true mean. It provides a way to express the reliability of the estimate.
The sample mean is the average value of a set of observations from a sample, calculated by summing all the sample values and dividing by the number of observations. It serves as a point estimate of the population mean and is central to inferential statistics, as it helps in making predictions about the population based on the sample data.