Here are the essential concepts you must grasp in order to answer the question correctly.
Sine and Cosine Functions
Sine and cosine are fundamental trigonometric functions that describe the relationship between angles and the ratios of sides in a right triangle. The sine function, sin(x), represents the ratio of the opposite side to the hypotenuse, while the cosine function, cos(x), represents the ratio of the adjacent side to the hypotenuse. These functions are periodic, with a period of 2π, meaning they repeat their values every 2π radians.
Recommended video:
Graph of Sine and Cosine Function
Graphing Trigonometric Functions
Graphing trigonometric functions involves plotting the values of sine and cosine over a specified interval, such as 0 to 2π. The graph of y = 1/2 sin x + cos x combines the effects of both sine and cosine, resulting in a wave-like pattern. Understanding how to manipulate the amplitude and phase shift of these functions is crucial for accurately representing their combined behavior on a graph.
Recommended video:
Introduction to Trigonometric Functions
Amplitude and Phase Shift
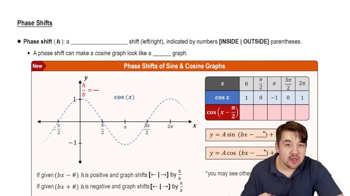
Amplitude refers to the height of the wave from its midline to its peak, affecting how 'tall' or 'short' the graph appears. In the equation y = 1/2 sin x + cos x, the coefficient of sin x (1/2) indicates that the sine wave's amplitude is halved. Phase shift involves horizontal shifting of the graph, which can occur when functions are added or subtracted, impacting the overall shape and position of the resulting graph.
Recommended video: