Determine the amplitude of each function. Then graph the function and y = sin x in the same rectangular coordinate system for 0 ≤ x ≤ 2π. y = -3 sin x
Verified step by step guidance
1
Identify the general form of the sine function, which is \(y = A \sin x\), where \(A\) represents the amplitude of the function.
Recall that the amplitude of a sine function is the absolute value of the coefficient in front of \(\sin x\). This means the amplitude is \(|A|\).
For the given function \(y = -3 \sin x\), determine the amplitude by taking the absolute value of \(-3\), which is \(| -3 |\).
Understand that the amplitude represents the maximum distance from the midline (usually the x-axis) to the peak or trough of the wave.
To graph the function along with \(y = \sin x\) on the interval \(0 \leq x \leq 2\pi\), plot both functions on the same coordinate system, noting that \(y = -3 \sin x\) will have peaks and troughs three times as far from the x-axis compared to \(y = \sin x\), and it will be reflected across the x-axis due to the negative sign.
Verified video answer for a similar problem:
This video solution was recommended by our tutors as helpful for the problem above
Video duration:
5m
Play a video:
0 Comments
Key Concepts
Here are the essential concepts you must grasp in order to answer the question correctly.
Amplitude of a Sine Function
The amplitude of a sine function is the absolute value of the coefficient in front of the sine term. It represents the maximum distance the graph reaches above or below the midline. For y = -3 sin x, the amplitude is |−3| = 3, indicating the wave oscillates 3 units from the center line.
Graphing a sine function involves plotting points based on its amplitude, period, phase shift, and vertical shift. The basic sine curve oscillates between -1 and 1 over one period of 2π. Adjusting the amplitude stretches or compresses the graph vertically, affecting the height of peaks and troughs.
Plotting y = -3 sin x alongside y = sin x on the same axes helps visualize differences in amplitude and reflection. The negative sign reflects the sine curve across the x-axis, while the amplitude change alters the height. Comparing both functions over 0 ≤ x ≤ 2π highlights these transformations clearly.

 Verified step by step guidance
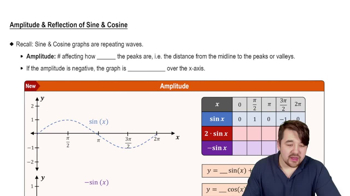
 5:05
5:05
