2. Describing Data with Tables and Graphs / Histograms / Problem 2
Problem 2
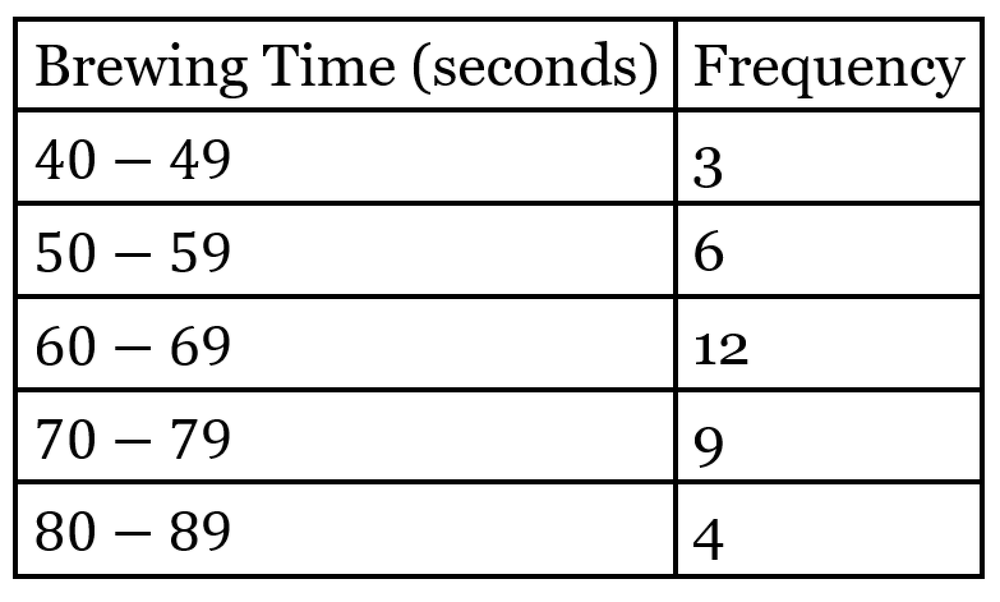
Create a histogram using the frequency distribution of coffee brewing times (in seconds) shown below. Does the histogram appear to show data from a normal distribution when the requirements for normal distribution are strictly applied?