2. Describing Data with Tables and Graphs / Histograms / Problem 1
Problem 1
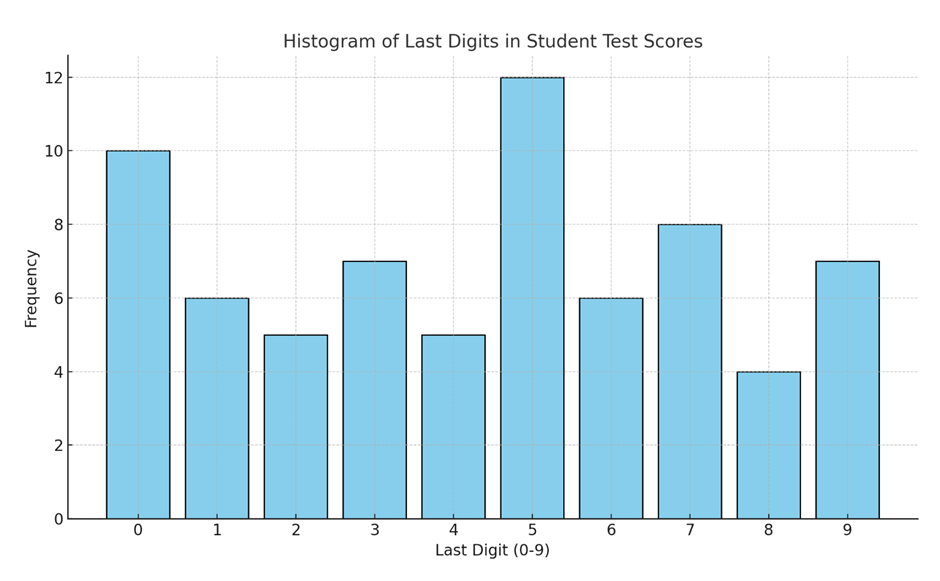
Shown below is a histogram of the last digits (units place) of scores from a large set of test results from a high school math department. Each score is out of , and the last digit ( through ) is recorded for analysis. Identify the frequencies of each digit. Then, test the claim that the last digits of the scores are uniformly distributed—that is, each digit from to is equally likely. Use level of significance. Does the data suggest any potential grading bias or irregularity in how scores are assigned?