2. Describing Data with Tables and Graphs / Histograms / Problem 5
Problem 5
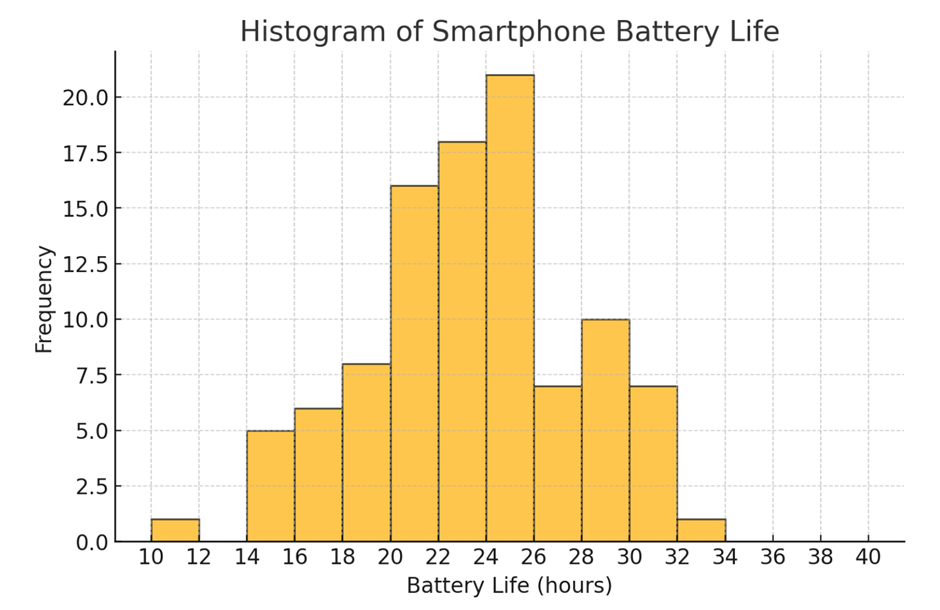
Use the following histogram generated by statistical software, which represents the battery life (in hours) of a sample of smartphones. (The values on the horizontal scale are rounded.) What is the approximate number of smartphones represented in the three bars farthest to the right?