2. Describing Data with Tables and Graphs / Histograms / Problem 6
Problem 6
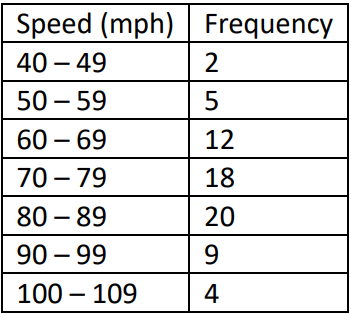
Vehicle Speeds on a Highway: Utilizing the following frequency distribution data, construct a histogram to answer the given question: Does the histogram appear to be skewed? If so, identify the type of skewness.