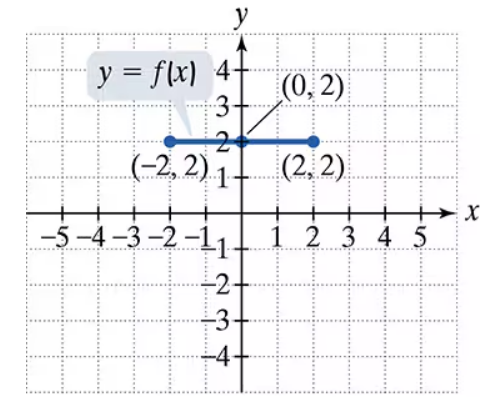
Use the graph of y = f(x) to graph each function g. g(x) = f(x/2)
Verified step by step guidance
1
Step 1: Understand the transformation g(x) = f(x/2). This transformation involves a horizontal stretch of the graph of f(x) by a factor of 2. Each x-coordinate of the points on the graph of f(x) will be multiplied by 2, while the y-coordinates remain unchanged.
Step 2: Identify the key points on the graph of f(x). From the graph, the points are (1, -3) and (4, -3). These points will be transformed according to the horizontal stretch.
Step 3: Apply the transformation to the x-coordinates of the points. Multiply each x-coordinate by 2: For (1, -3), the new x-coordinate is 1 * 2 = 2, so the transformed point is (2, -3). For (4, -3), the new x-coordinate is 4 * 2 = 8, so the transformed point is (8, -3).
Step 4: Plot the transformed points (2, -3) and (8, -3) on the graph. These points represent the new positions of the graph after the horizontal stretch.
Step 5: Draw the graph of g(x) = f(x/2) by connecting the transformed points with a horizontal line, maintaining the same y-value (-3) across the stretch.
Verified video answer for a similar problem:
This video solution was recommended by our tutors as helpful for the problem above
Video duration:
1m
Play a video:
0 Comments
Key Concepts
Here are the essential concepts you must grasp in order to answer the question correctly.
Function Transformation
Function transformation refers to the process of altering the graph of a function through various operations, such as shifting, stretching, or compressing. In this case, the function g(x) = f(x/2) represents a horizontal stretch of the original function f(x) by a factor of 2, meaning that every x-coordinate in the graph of f(x) is doubled in g(x).
A horizontal stretch occurs when the x-values of a function are multiplied by a factor less than 1. For g(x) = f(x/2), the x-values are effectively halved, which stretches the graph horizontally. This transformation results in the graph of g(x) appearing wider than that of f(x), as points that were originally close together on f(x) will be spaced further apart on g(x).
Graph interpretation involves analyzing the visual representation of a function to extract information about its behavior, such as intercepts, maxima, minima, and overall shape. In this exercise, understanding the graph of f(x) is crucial to accurately sketching g(x), as it allows one to see how the transformation affects the positions of key points and the overall structure of the graph.

 Verified step by step guidance
 4:22
4:22