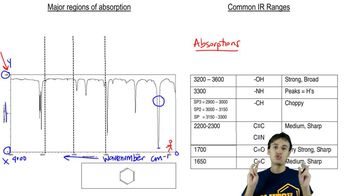
Ch. 12 - Infrared Spectroscopy and Mass Spectrometry
Wade - Organic Chemistry 9th Edition
Wade9th EditionOrganic ChemistryISBN: 9780135213728Not the one you use?Change textbook
Chapter 12, Problem 29

The ultimate test of fluency in MS and IR is whether you can determine a moderately complex structure from just the MS and the IR, with no additional information. The IR and MS of a compound are shown below. Use everything you know about IR and MS, plus reasoning and intuition, to determine a likely structure. Then show how your proposed structure is consistent with these spectra.
<IMAGES>

Verified step by step guidance
1
Examine the mass spectrum provided. Identify the molecular ion peak (M+) which represents the molecular weight of the compound. In this case, the peak at m/z = 107 is likely the molecular ion peak.
Look for significant fragment peaks in the mass spectrum. For example, peaks at m/z = 77 and 79 suggest the presence of a benzene ring or aromatic structure due to common fragmentation patterns.
Analyze the IR spectrum (not shown here). Identify key functional group absorptions, such as C=O stretching (around 1700 cm⁻¹), O-H stretching (broad peak around 3200-3600 cm⁻¹), or C-H stretching (around 2800-3000 cm⁻¹). These will help narrow down the functional groups present in the compound.
Combine the information from the mass spectrum and IR spectrum. For example, if the IR spectrum shows a strong C=O stretch, the compound may contain a ketone or aldehyde. If an O-H stretch is present, it may be an alcohol or carboxylic acid.
Propose a structure consistent with the molecular weight (107), fragmentation patterns (aromatic ring), and functional groups identified in the IR spectrum. Ensure the structure accounts for all observed peaks and spectral data.

Verified video answer for a similar problem:

This video solution was recommended by our tutors as helpful for the problem above.
Video duration:
6m
Was this helpful?

Key Concepts

Here are the essential concepts you must grasp in order to answer the question correctly.

Mass Spectrometry (MS)

Mass spectrometry is an analytical technique used to measure the mass-to-charge ratio of ions. It provides information about the molecular weight of compounds and their structural features by generating a mass spectrum, which displays the relative abundance of ions at different m/z (mass-to-charge) values. Key peaks in the spectrum correspond to the molecular ion and fragment ions, which can help deduce the structure of the compound.
Recommended video:
Guided course
01:25
How to Read a Mass Spectrum

Infrared Spectroscopy (IR)

Infrared spectroscopy is a technique that measures the absorption of infrared light by a compound, providing information about its molecular vibrations and functional groups. The resulting IR spectrum displays peaks corresponding to specific bond vibrations, allowing chemists to identify functional groups present in the molecule. This information is crucial for confirming the presence of certain structures and guiding the interpretation of the mass spectrum.
Recommended video:
Guided course
16:04
General Features of IR Spect

Structural Elucidation

Structural elucidation involves determining the molecular structure of a compound based on analytical data from techniques like MS and IR. By analyzing the mass spectrum for molecular weight and fragmentation patterns, alongside the IR spectrum for functional group identification, chemists can propose a likely structure. This process requires integrating data from both techniques to ensure consistency and accuracy in the proposed molecular structure.
Recommended video:
Guided course
03:04
Drawing Resonance Structures
Related Practice
Textbook Question

These five structures all have distinguishing absorptions in the IR. Match each structure with its characteristic absorption.

(a) sharp, 2254 cm–1

(b) very broad, centered about 3330 cm–1

(c) strong, slightly broadened, 1645 cm–1

(d) broad with spikes at 3367 and 3292 cm–1

(e) strong, sharp 1717 cm–1

1464
views
Textbook Question

A laboratory student added 1-bromobutane to a flask containing dry ether and magnesium turnings. An exothermic reaction resulted, and the ether boiled vigorously for several minutes. Then she added acetone to the reaction mixture and the ether boiled even more vigorously. She added dilute acid to the mixture and separated the layers. She evaporated the ether layer, and distilled a liquid that boiled at 143 °C. GC–MS analysis of the distillate showed one major product with a few minor impurities. The mass spectrum of the major product is shown here.

(a) Draw out the reactions that took place and show the product that was formed.

<IMAGE>

1405
views
Textbook Question

Three common lab experiments are shown. In each case, describe how the IR spectrum of the product would differ from that of the reactant. Give approximate frequencies for distinctive peaks in the IR spectrum of the reactant and also that of the product.

1349
views
Textbook Question

Consider the following four structures, followed by mass spectral data. Match each structure with its characteristic molecular ion or fragment. In each case, give a likely structure of the ion responsible for the base peak.

(a) base peak at 105

(b) base peak at 72

(c) M+ doublet at 198 and 200, base peak at 91

(d) base peak at 91, large peak at 43

1466
views
Textbook Question

A laboratory student added 1-bromobutane to a flask containing dry ether and magnesium turnings. An exothermic reaction resulted, and the ether boiled vigorously for several minutes. Then she added acetone to the reaction mixture and the ether boiled even more vigorously. She added dilute acid to the mixture and separated the layers. She evaporated the ether layer, and distilled a liquid that boiled at 143 °C. GC–MS analysis of the distillate showed one major product with a few minor impurities. The mass spectrum of the major product is shown here.

(b) Explain why the molecular ion is or is not visible in the mass spectrum, and show what ions are likely to be responsible for the strong peaks at m/z 59 and 101.

<IMAGE>

1398
views